


3D Viewers
NGL
The NGL 3D View option from the RCSB PDB structure summary page utilizes the WebGL-based NGL Viewer [Rose2015], [Rose2016], to display PDB structures in three-dimensions.
Various general display options are available from the main window and three types of views are available:
General Display Options
Various display options are available from the main section of the 3D view page:
- Spin: Start or stop spinning the structure along the y-axis
- Fullscreen: Activate or disable fullscreen mode
- Center: Reset molecule position
- Screenshot: Download screenshot at twice the displayed resolution. When creating screenshots, set the 'Quality' option (in the "Structure View" tab to 'high' for the best results.
- Background: Choose white or black background color.
- Focus: Move clipping planes closer to or away from the center of rotation
Mouse Controls
Rotate the view around the center of the canvas
- Left-mouse drag
- One-finger drag
Translate the view and move the center of rotation
- Right-mouse drag
- Two-finger drag
- Ctrl left-mouse drag
Zoom the view in and out
- Scroll-wheel
- Two-finger pinch
- Shift left-mouse drag
Show information (tooltips) about the object close to the mouse cursor or finger tap such as atoms or bonds
- Mouse hover
- Finger tap
Move the clipping/focus planes in and out
- Shift scroll-wheel
Increase/decrease the isolevel value of the selected electron density map
- Ctrl scroll-wheel
Combination "Move the clipping/focus planes in and out" and "Zoom the view in and out"
- Middle-mouse drag
- Shift-ctrl scroll-wheel
Distance, angle, dihedral measurements: To begin a measurement, use the right-mouse button (or the left-mouse button and the Control key/Control key and mouse click) to select 1, 2, 3 or 4 atoms. Complete the measurement by selecting the final atom twice. Depending on how many atoms are selected, the distance (2 atoms), the angle (3 atoms) or the dihedral angle (4 atoms) is measured and displayed. Deselect all atoms with a right-click in empty space. To remove a measurement, re-select all involved atoms and then the last atom twice in a row.
Structure View
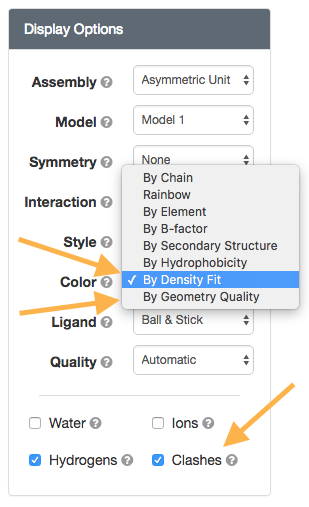
Various display options are available from the Structure View tab of the 3D view page:
- Assembly: View structure as asymmetric unit, biological assembly, unit cell, or supercell (stacked unit cells)
- Model: View specific model for multi-model structure
- Symmetry: View intrinsic molecular symmetry. This option is described in additional detail below.
- Style: View the structure in different representation styles (Backbone, Surface, Cartoon, Spacefill/CPK, Licorice, Line, and Ball & Stick)
- Color: Color the structure using different color schemes. See below for a list and additional information.
- Ligand: Change the ligand representation style -- ligands can be displayed as ball-and-stick, space fill or turned off.
- Quality: Adjust the rendering quality. When creating screenshots, set this option to 'high' for the best results
- Water: Show or hide water molecules present in the structure
- Ions: Show or hide ions present in the structure
- Hydrogens: Show or hide hydrogen atoms included in the structure
- Clashes: Show or hide clashes between atoms (indicated by pink disks) as given in the Validation Report. See below for additional information.
- Default Structure View: Return the viewer to the default settings.
Color schemes
Rainbow - blue is the N-terminus and red is the C-terminus
By Chain - colored by chain as found in the asymmetric unit
By B-factor - colored from red (highest B-factors in the structure) to tan (lowest B-factor in the structure)
By Hydrophobicity -- colored from red (hydrophilic) to green (hydrophobic). It uses the experimentally determined hydrophobicity scale based on whole residue free energies of transfer ΔG (kcal/mol) from water to POPC interface as reported by Wimley and White.
By Element/CPK
By Residue - Amino acids
By Residue - Nucleotides
By Secondary Structure (as determined by DSSP) plus DNA, RNA and carbohydrate
For By Density Fit, By Geometry Quality and By Random Coil Index. See Validation Report section for details.
Structure View: Symmetry
Protein Symmetry
Protein symmetry refers to point group or helical symmetry of identical subunits (>= 95% sequence identity over 90% of the length of two proteins). While a single protein chain with L-amino acids cannot be symmetric (point group C1), protein complexes with quaternary structure can have rotational and helical symmetry.
Complexes are considered symmetric if identical subunits superpose with their symmetry related copies within <= 7 Å Cα RMSD. Protein subunits are considered identical if their pairwise sequence identity is >= 95% over 90% of the length of both sequences, to account for minor sequence variations such as point mutations and truncated or disordered N- and C-terminal segments. Protein chains with less than 20 residues are excluded, unless at least half of the chains are shorter than 20 residues. Nucleic acids and carbohydrate chains, as well as ligands are excluded. Split entries (entries divided between multiple coordinate files due to the limitations of the PDB file format) are currently excluded from the protein stoichiometry and protein symmetry features.
Protein Pseudosymmetry
Pseudosymmetry refers to symmetry of homologous protein subunits. Protein complexes with pseudostoichiometry may have a higher structural symmetry than the symmetry calculated based on sequence identity. If we consider hemoglobin again, at a 95% sequence identity threshold the alpha and beta subunits are considered different, which correspond to an A2B2 stoichiometry and a C2 point group. At the structural similarity level, all four chains are considered homologous (~45% sequence identity) with an A4 pseudostoichiometry and D2 pseudosymmetry.
Global Symmetry
Global symmetry refers to the symmetry of the entire complex. Protein complexes may be symmetric, pseudosymmetric, or asymmetric.
Local Symmetry
Asymmetric protein complexes may have local symmetry. Similar to global symmetry, we distinguish local symmetry of identical subunits and local pseudosymmetry of homologous subunits.
Structure View: Color (By Density Fit and By Geometry Quality) and Clashes option
wwPDB Validation Reports are available for every entry in the archive to provide an assessment of the quality of a structure and highlight specific concerns by considering the model coordinates, experimental data, and fit between the two. RCSB PDB Structure Summary pages contain the "slider" graphic that provides a visual summary, and link to the full report (PDF).
The Color 'By Density Fit' and 'By Geometry Quality' options map wwPDB Validation Report information onto the 3D structure. Clashes can be displayed as pink disks using the "Clashes" toggle.
|
| 3D Validation report options |
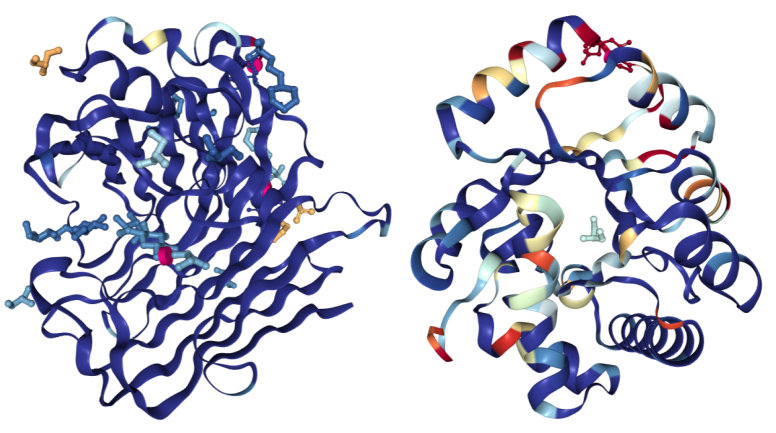
Color By Density Fit
For structures determined using X-ray crystallography for which structure factors have been deposited, the "Density Fit" scheme colors a structure according to the quality of agreement between the model and the experimental electron density. Blue indicates a good fit for a residue and red a bad fit. Residue coloring is determined using normalized Real Space R (RSRZ) for polymer residues and real space correlation coefficient (RSCC) for ligands. Colors range from red (RSRZ = -2 or RSCC = 0.678) - through white - to blue (RSRZ = 0 or RSCC = 1.0):
Key: Color by Density Fit
The images below have been colored using the "Density Fit" scheme. On the left is a structure of Endoglucanase A (PDB ID 3WY6) with a generally good fit; on the right a structure of Ribonuclease P protein component 3 (PDB ID 3WYZ), which has areas of more problematic fit. For details regarding RSRZ and RSCC, please consult the Validation Report User Guide for X-ray structures.
|
| Hydrolases colored using the Density Fit scheme. |
Color By Geometry Quality
The "Geometry Quality" coloring scheme colors each polymer residue and ligand molecule according to the number of geometric issues (blue for 0, yellow for 1, orange for 2, and red for 3 or more):
Key: Color by Geometry Quality, # of geometry problems
Protein residues and nucleotides are colored per residue whereas ligand molecules are colored per atom. Possible geometric issues include steric clashes, Ramachandran or RNA backbone outliers, and sidechain conformation outliers.
The image below shows PDB entry 1FCC, a 3.2 Angstrom resolution structure with worse overall quality relative to all X-ray structures colored by Geometry Quality.

PDB entry 1FCC, a 3.2 Angstrom resolution structure with worse overall quality relative to all X-ray structures colored by Geometry Quality.
Clashes option
With this option, clashes between pairs of atoms are displayed as pink discs, with the size of each disc reflecting the degree of van der Waals (vdW) overlap between the two atoms. Clash display is currently not available for structures comprising more than 10,000 residues. Information on how these geometry quality criteria are calculated is available at wwPDB.org.
In the image below a clash between two atoms in entry 1D66 is indicated by a pink disc, showing how much the atoms' vdW spheres overlap. In this example, the structure has been colored using the "Geometry Quality" scheme, which indicates that this clash is the only geometric issue for these two residues.
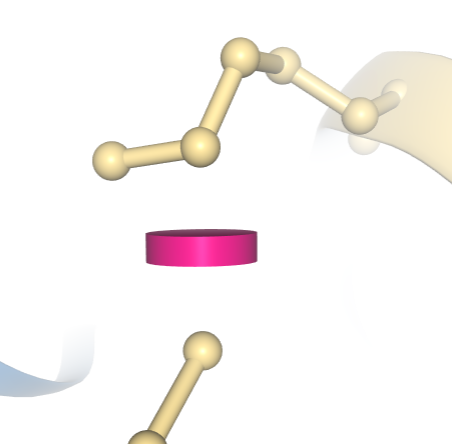
A clash between two atoms in PDB ID 1D66 is indicated by a pink disc, showing how much the atoms' vdW spheres overlap. In this example, the structure has been colored using the "Geometry Quality" scheme, which indicates that this clash is the only geometric issue for these two residues.
Color By NMR Random Coil Index
For NMR structures for which chemical shift data have been deposited, the "NMR Random Coil Index" (RCI) scheme colors a structure according to the probability that the given residue is disordered ("random coil-like"). The color of each residue indicates whether the residue is classified as rigid (blue, RCI = 0.0) or flexible (red, RCI = 0.6). Residue coloring is based on the measured chemical shifts and on the primary sequence of the protein chain [Berjanskii2005], [Berjanskii2008]. Residues without chemical shift data in the chemical shift file are displayed in gray.
Key: Color by Random Coil Index
Ligand Viewer Options
For entries containing ligands, the Ligand View offers various ligand-related display options:
- Ligand: Select the ligand to display
- Opacity: Change the opacity of the ligand binding pocket
- Near Clipping: Adjust the clipping plane for the ligand binding pocket
- Radius Clipping: Change the radius of the clipping sphere around the ligand binding pocket
- Color: Color the pocket surface using different schemes (element/CPK, hydrophobicity, and B-factor - see above for descriptions of the coloring)
- Interactions: Show or hide various interactions (Hydrophobic Contacts, Hydrogen Bonds, Halogen Bonds, Metal Interactions, Pi Interactions) that are colored according to the scheme below
- Label: Display or hide labels for the ligand and neighboring residues.
- Polymer Display: Show or hide the current polymer display
- Default ligand view: Return the viewer to the default settings.
| hydrogen bonds | |
| hydrophobic contacts | |
| halogen bonds | |
| metal interactions | |
| cation-pi interactions | |
| pi-stacking interactions |
Note that there might be no binding pocket surface because the ligand is not interacting/not close enough with/to the macromolecule. The binding pocket surface is a surface of the macro molecule, that is, it ignores ligands, water, ions, ...
Interaction Types Definition and Calculation Parameters
Hydrogen Bonds
Hydrogen bonds [Stickle1992], [Zhou2008] are calculated according to the following parameters between donor and acceptor atoms.
Note that hydrogens are not required for the generation of hydrogen bonds, and indeed are ignored if present. While the aim is to find all potential hydrogen bonds a comprehensive global analysis to find the optimal hydrogen bonding network is not performed as this would require a global analysis of protonation states.
Donor atoms: In general all nitrogen, oxygen, and sulfur atoms that have a hydrogen count greater 1 according to our valence model can be considered donors (for carbon as a donor see the heading Weak Hydrogen Bonds). Any nitrogen in a His ring may also be a donor.
Acceptor atoms: All oxygen atoms are considered to be acceptors. Nitrogen atoms are considered to be acceptors when the charge is less than 1 and at least one lone pair is not conjugated according to our valence model. Aminoacids (table-based, in addition to the general rule). Any nitrogen atom in a ring in His (to work around the ambiguity of where the charge is). Sulfur atoms are considered to be acceptors if the formal charge is -1 or if they are present in Cys or Met.
The maximum donor to acceptor distance is generally 3.5 Å and 4.1 Å for bonding with sulfur atoms. Angles are checked according to the following guidelines:
- Maximum 45 degree deviation from optimal (90 degree) acceptor angle (AA-A-D)
- Maximum 45 degree deviation from optimal (90 for sp2, 60 for sp3) donor angle (DA-D-A)
- Maximum 90 degree deviation from optimal (0 degree) acceptor plane angle (A-D to A-AA-AA’ or AAA instead of AA’)
- Maximum 30 degree deviation from optimal (0 degree) donor plane angle (D-A to D-DA-DA’ or DAA instead of DA’)

|
| Legend: Donor (D), Hydrogen (H), Donor-Antecedent (DA), Donor-Antecedent-Antecedent (DAA), Acceptor (A), Acceptor-Antecedent (AA), Acceptor-Antecedent-Antecedent (AAA). |
Halogen Bonds
Halogen bonds [Auffinger2004] are calculated according to the following parameters: Donors can be X-C, where X is Cl, Br, I or At but not F (no sigma-hole). Acceptors can be Y-{O|N|S} where Y is C, P, N, or S. The maximum Halogen bond distance is 3.5 Å. The maximum angle deviation is 30 degrees optimal in which the C-X···O angle ≈180° (consistent with a strong directional polarization of the halogen) and the X···O-Y angle ≈120°.
Hydrophobic Contacts
Hydrophobic contacts [Freitas2017] are calculated according to the following parameters: Contacts are made between carbons that are connected only to carbon or hydrogen, the default maximum hydrophobic distance is 4.0 Å, for atoms that interact with several atoms in the same residue, only the one with the closest distance is kept, and hydrophobic contacts between pi-stacked aromatic rings are removed.
Metal Interactions
Metal Interaction types are defined as dative bonds and ionic/ionic-type interactions between metal classes and potential metal binding partners.
Potential metal binding partners
Nucleobases
- Sugar oxygens (atom names O2’, O3’, O4’): dative, ionic
- Selected base nitrogens (N3, N4, N7): dative
- Selected base oxygens (O2, O4, O6): dative, ionic
Aminoacids
- Oxygen in backbone: dative, ionic
- Oxygen in Asp, Glu, Ser, Thr, Tyr, Asn, Gln sidechain: dative, ionic
- Sulfur in Cys sidechain: dative, ionic
- Nitrogen in His sidechain: dative
Halogens
- Dative, ionic
Functional groups from ligands
- O, N, S, Halogens: dative
- O, S, Halogens: ionic
Metals classes
Alkali & Alkaline earth Li, Na, K, Rb, Cs, Mg, Ca, Sr, Ba and other Al,Ga,In,Tl, Sc, Sn, Pb, Bi, Sb, Hg
- ionic-type
Transition metals
- dative, ionic
- metal-metal
Pi Interactions
Cation-Pi
Cation-Pi interactions [Gallivan1999] are defined as a contact between a positive charge center (see heading "Charge centers" below) and aromatic ring (see heading "Pi-Stacking" below) in wihch the maximum distance between ring and charge center is 6 Å and the maximum offset of ring and charge center is 1.5 Å.
Pi-stacking
Pi-stacking interactions [McGaughey1998] are the parallel or T-shaped stacking of aromatic rings. The aromaticity of a ring is deduced from flags of its member atoms (when available) or by checking if the ring is planar and contains only B, C, N, O, Si, P, S, Ge, As, Sn, Sb, Bi atoms. These interactions are included when the maximum distance between ring centers is 5.5 Å. The maximum offset of ring centers is 2.0 Å (about the radius of benzene plus 0.5 Å), the maximum deviation from optimal angle (0 for parallel, 90 for t-shaped) is 30 degree.
Charge centers
Positive charge centers can be: nitrogen sidechain atoms in Arg, His, Lys; atoms in Guanidine, Acetamidine groups; atoms with a positive charge according to our valence model. Negative charge centers can be: oxygen sidechain atoms in Glu, Asp; atoms in Sulfonic Acid, Phosphate (including DNA/RNA), Sulfate or Carboxylate; atoms with a negative charge according to our valence. Hydrogen bonds between atoms in the charge groups are not shown.
Electron Density Maps
Electron density maps combine the structural model (coordinates) and the experimentally-collected data from an X-ray structure determination and serve to represent the fit of the model to the data. There are two types of electron density maps commonly used by researchers: the 2fo-fc map and the fo-fc map. The fo-fc (also called a difference or omit map) map shows what has been overrepresented or not accounted for by the model, while the 2fo-fc map includes the fo-fc map and electron density around the model.
These two maps are then used to correct the model when possible. Even in the best quality structures, there are areas of poor electron density, which may represent sections of the model that exist in multiple conformations. This can be seen in long side chains or surface loops of the model.
For additional background, please see Structure Factors and Electron Density at PDB-101 and for additional information on the generation and downloading of maps at the RCSB, please see the X-ray Electron Density Maps FAQ.
The Electron Density Maps tab offers various display options:
- Map: Turn on or off the 2fo-fc map display (colored blue) and/or the fo-fc (negative density is colored red and positive peaks are colored green).
- Scroll: Select the map whose isolevel value will be changed with the mouse via "Ctrl scroll-wheel". See also: the Level option.
- Level: The value at which the isosurface of the map is shown (in sigma values). This value can be adjusted using the sliders for each map type or using the mouse via "Ctrl scroll-wheel".
- Map Style: Select the map display style (mesh, smooth, or flat).
- Map Size: For efficiency, only a portion of the map is displayed. The map size option adjusts the size (in Å along each of the three crystallographic axes) of this portion.
- Ligand: Recenter the view around the selected ligand.
- Default maps view: Adjusts the view settings to be optimized for electron density map display.
References
- [Auffinger2004] P Auffinger, FA Hays, E Westhof, and PS Ho. Halogen bonds in biological molecules. PNAS, 2004. doi:10.1073/pnas.0407607101
- [Berjanskii2005]MV Berjanskii and DS Wishart. A Simple Method To Predict Protein Flexibility Using Secondary Chemical Shifts. J. Am. Chem. Soc., 2005. doi:10.1021/ja054842f
- [Berjanskii2008]MV Berjanskii and DS Wishart. Application of the random coil index to studying protein flexibility. J Biomol NMR. 2008. doi:10.1007/s10858-007-9208-0
- [Freitas2017] RF de Freitas and M Schapira. A systematic analysis of atomic protein–ligand interactions in the PDB. Med Chem Commun, 2017. doi:10.1039/C7MD00381A
- [Gallivan1999] JP Gallivan and DA Dougherty. Cation-π interactions in structural biology. PNAS, 1999. doi:10.1073/pnas.96.17.9459
- [McGaughey1998] GB McGaughey, M Gagné and AK Rappé. π-Stacking Interactions - ALIVE AND WELL IN PROTEINS. JBC, 1998. doi:10.1074/jbc.273.25.15458
- [Rose2015] AS Rose and PW Hildebrand. NGL Viewer: a web application for molecular visualization. Nucl Acids Res, 2015. doi:10.1093/nar/gkv402
- [Rose2016] AS Rose, AR Bradley, Y Valasatava, JM Duarte, A Prlić and PW Rose. Web-based molecular graphics for large complexes. ACM Proceedings of the 21st International Conference on Web3D Technology, 2016. doi:10.1145/2945292.2945324
- [Stickle1992] DF Stickle, LG Presta, KA Dill, GD Rose. Hydrogen bonding in globular proteins. JMB, 1992. doi:10.1016/0022-2836(92)91058-W
- [Wimley1996] W Wimley and SH White. Experimentally determined hydrophobicity scale for proteins at membrane interfaces. Nature Structural Biology, 1996. doi:10.1038/nsb1096-842
- [Zhou2008] P Zhou, F Tian, F Lv, Z Shang. Geometric characteristics of hydrogen bonds involving sulfur atoms in proteins. Proteins, 2008. doi:10.1002/prot.22327
- [Rose2018] AS Rose, AR Bradley, Y Valasatava, JM Duarte, A Prlić and PW Rose. NGL viewer: web-based molecular graphics for large complexes. Bioinformatics, 2018. doi:10.1093/bioinformatics/bty419
