4XE5

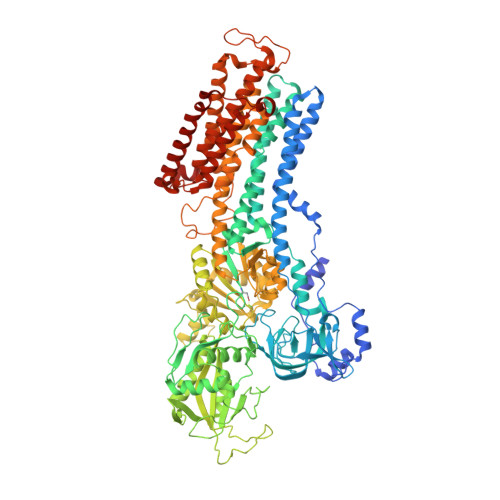
Crystal structure of the Na,K-ATPase from bovine


Experimental Data Snapshot

  • Method: X-RAY DIFFRACTION
  • Resolution: 3.90 Å
  • R-Value Free: 0.336 
  • R-Value Work: 0.322 
  • R-Value Observed: 0.323 

Starting Model: experimental
View more details

wwPDB Validation   3D Report Full Report


Ligand Structure Quality Assessment 


This is version 1.6 of the entry. See complete history


Literature

Isolation, crystallization and crystal structure determination of bovine kidney Na(+),K(+)-ATPase.

Gregersen, J.L.Mattle, D.Fedosova, N.U.Nissen, P.Reinhard, L.

(2016) Acta Crystallogr F Struct Biol Commun 72: 282-287

  • DOI: https://doi.org/10.1107/S2053230X1600279X
  • Primary Citation of Related Structures:  
    4XE5

  • PubMed Abstract: 

    Na(+),K(+)-ATPase is responsible for the transport of Na(+) and K(+) across the plasma membrane in animal cells, thereby sustaining vital electrochemical gradients that energize channels and secondary transporters. The crystal structure of Na(+),K(+)-ATPase has previously been elucidated using the enzyme from native sources such as porcine kidney and shark rectal gland. Here, the isolation, crystallization and first structure determination of bovine kidney Na(+),K(+)-ATPase in a high-affinity E2-BeF3(-)-ouabain complex with bound magnesium are described. Crystals belonging to the orthorhombic space group C2221 with one molecule in the asymmetric unit exhibited anisotropic diffraction to a resolution of 3.7 Å with full completeness to a resolution of 4.2 Å. The structure was determined by molecular replacement, revealing unbiased electron-density features for bound BeF3(-), ouabain and Mg(2+) ions.


  • Organizational Affiliation

    Centre for Membrane Pumps in Cells and Disease - PUMPkin, Danish National Research Foundation, Denmark.


Macromolecules
Find similar proteins by:  (by identity cutoff)  |  3D Structure
Entity ID: 1
MoleculeChains Sequence LengthOrganismDetailsImage
Sodium/potassium-transporting ATPase subunit alpha-11,021Bos taurusMutation(s): 0 
EC: 3.6.3.9 (PDB Primary Data), 7.2.2.13 (UniProt)
Membrane Entity: Yes 
UniProt
Find proteins for Q08DA1 (Bos taurus)
Explore Q08DA1 
Go to UniProtKB:  Q08DA1
Entity Groups  
Sequence Clusters30% Identity50% Identity70% Identity90% Identity95% Identity100% Identity
UniProt GroupQ08DA1
Sequence Annotations
Expand
  • Reference Sequence
Find similar proteins by:  (by identity cutoff)  |  3D Structure
Entity ID: 2
MoleculeChains Sequence LengthOrganismDetailsImage
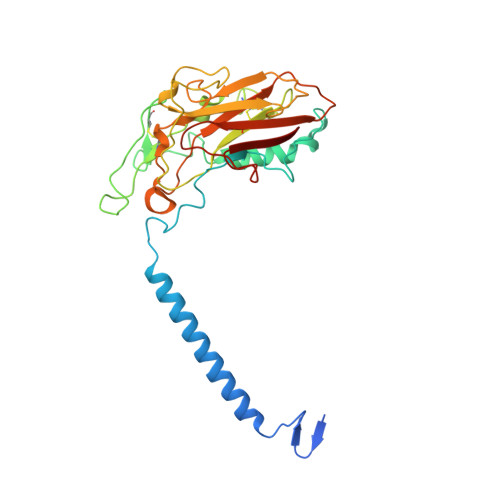
Sodium/potassium-transporting ATPase subunit beta303Bos taurusMutation(s): 0 
Membrane Entity: Yes 
UniProt
Find proteins for G3MWR4 (Bos taurus)
Explore G3MWR4 
Go to UniProtKB:  G3MWR4
Entity Groups  
Sequence Clusters30% Identity50% Identity70% Identity90% Identity95% Identity100% Identity
UniProt GroupG3MWR4
Sequence Annotations
Expand
  • Reference Sequence
Find similar proteins by:  (by identity cutoff)  |  3D Structure
Entity ID: 3
MoleculeChains Sequence LengthOrganismDetailsImage
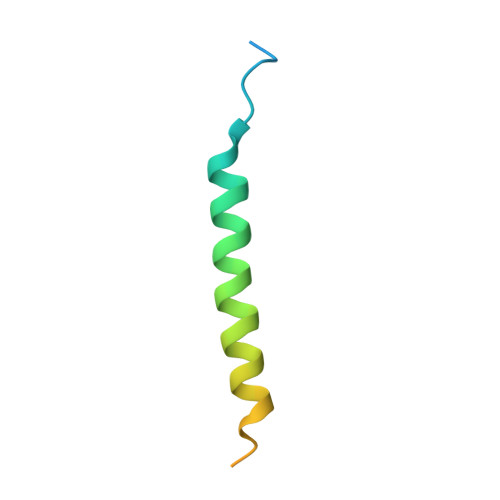
Sodium/potassium-transporting ATPase subunit gammaC [auth G]58Bos taurusMutation(s): 0 
Membrane Entity: Yes 
UniProt
Find proteins for Q04645 (Bos taurus)
Explore Q04645 
Go to UniProtKB:  Q04645
Entity Groups  
Sequence Clusters30% Identity50% Identity70% Identity90% Identity95% Identity100% Identity
UniProt GroupQ04645
Sequence Annotations
Expand
  • Reference Sequence
Small Molecules
Modified Residues  1 Unique
IDChains TypeFormula2D DiagramParent
BFD
Query on BFD
A
L-PEPTIDE LINKINGC4 H6 Be F3 N O4ASP
Binding Affinity Annotations 
IDSourceBinding Affinity
OBN BindingDB:  4XE5 Ki: min: 90, max: 97 (nM) from 2 assay(s)
IC50: min: 4.3, max: 4300 (nM) from 4 assay(s)
Experimental Data & Validation

Experimental Data

  • Method: X-RAY DIFFRACTION
  • Resolution: 3.90 Å
  • R-Value Free: 0.336 
  • R-Value Work: 0.322 
  • R-Value Observed: 0.323 
  • Space Group: C 2 2 21
Unit Cell:
Length ( Å )Angle ( ˚ )
a = 64.75α = 90
b = 301.07β = 90
c = 242.29γ = 90
Software Package:
Software NamePurpose
PHENIXrefinement
Cootmodel building
PHASERphasing
XSCALEdata scaling
XDSdata reduction

Structure Validation

View Full Validation Report


Ligand Structure Quality Assessment 


Entry History 

Deposition Data

Revision History  (Full details and data files)

  • Version 1.0: 2016-03-09
    Type: Initial release
  • Version 1.1: 2016-03-30
    Changes: Database references
  • Version 1.2: 2016-04-13
    Changes: Database references
  • Version 1.3: 2016-07-20
    Changes: Database references
  • Version 1.4: 2018-01-17
    Changes: Data collection
  • Version 1.5: 2024-01-10
    Changes: Data collection, Database references, Derived calculations, Refinement description
  • Version 1.6: 2024-11-06
    Changes: Structure summary