Statistical coupling analysis of aspartic proteinases based on crystal structures of the Trichoderma reesei enzyme and its complex with pepstatin A.
Nascimento, A.S., Krauchenco, S., Golubev, A.M., Gustchina, A., Wlodawer, A., Polikarpov, I.(2008) J Mol Biol 382: 763-778
- PubMed: 18675276
- DOI: https://doi.org/10.1016/j.jmb.2008.07.043
- Primary Citation of Related Structures:
3C9X, 3EMY - PubMed Abstract:
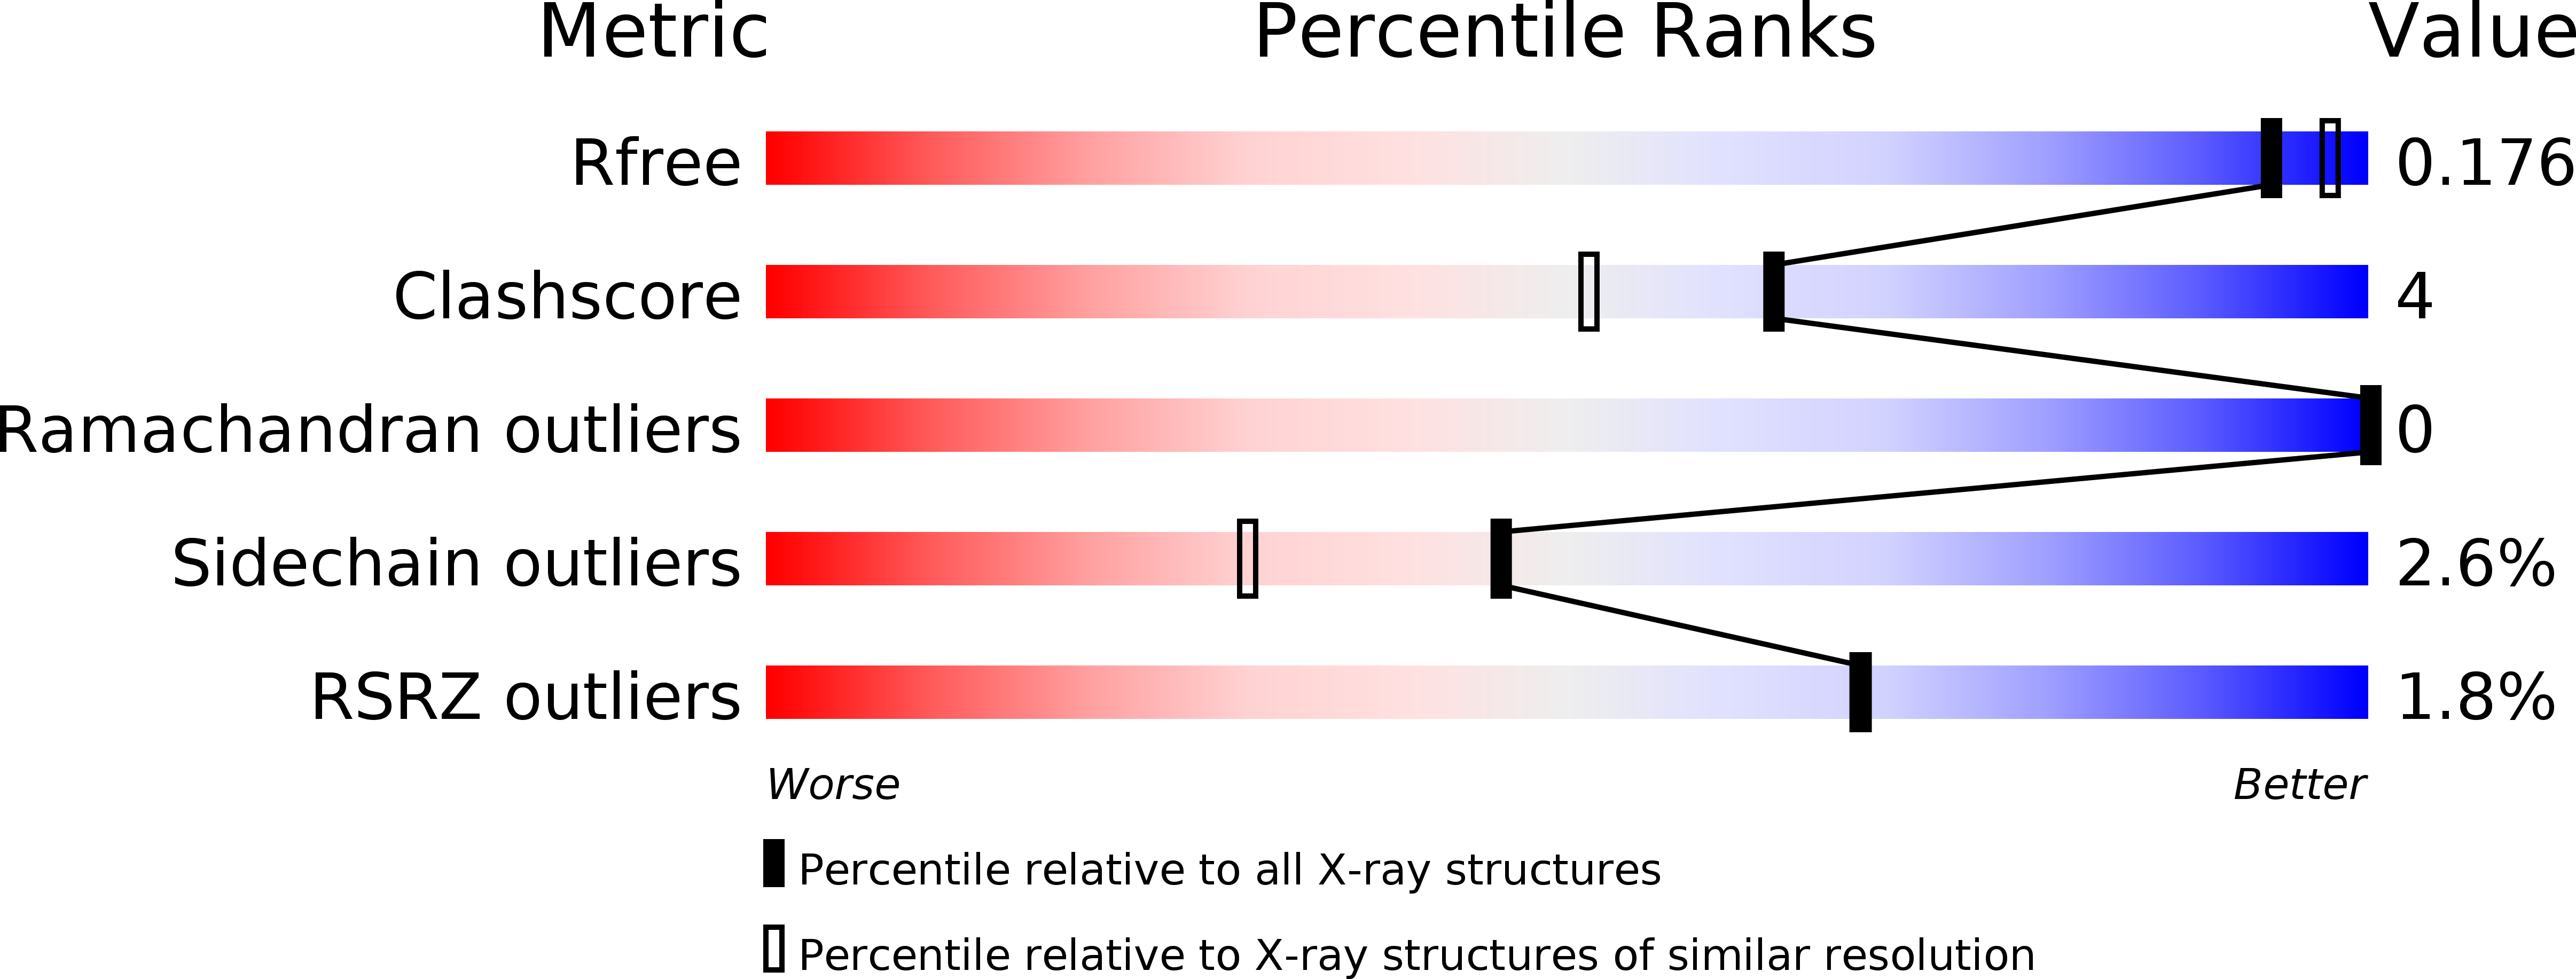
The crystal structures of an aspartic proteinase from Trichoderma reesei (TrAsP) and of its complex with a competitive inhibitor, pepstatin A, were solved and refined to crystallographic R-factors of 17.9% (R(free)=21.2%) at 1.70 A resolution and 15.8% (R(free)=19.2%) at 1.85 A resolution, respectively. The three-dimensional structure of TrAsP is similar to structures of other members of the pepsin-like family of aspartic proteinases. Each molecule is folded in a predominantly beta-sheet bilobal structure with the N-terminal and C-terminal domains of about the same size. Structural comparison of the native structure and the TrAsP-pepstatin complex reveals that the enzyme undergoes an induced-fit, rigid-body movement upon inhibitor binding, with the N-terminal and C-terminal lobes tightly enclosing the inhibitor. Upon recognition and binding of pepstatin A, amino acid residues of the enzyme active site form a number of short hydrogen bonds to the inhibitor that may play an important role in the mechanism of catalysis and inhibition. The structures of TrAsP were used as a template for performing statistical coupling analysis of the aspartic protease family. This approach permitted, for the first time, the identification of a network of structurally linked residues putatively mediating conformational changes relevant to the function of this family of enzymes. Statistical coupling analysis reveals coevolved continuous clusters of amino acid residues that extend from the active site into the hydrophobic cores of each of the two domains and include amino acid residues from the flap regions, highlighting the importance of these parts of the protein for its enzymatic activity.
Organizational Affiliation:
Grupo de Cristalografia, Departamento de Física e Informática, Instituto de Física de São Carlos, Universidade de São Paulo, Av. Trabalhador Saocarlense, 400, CEP 13560-970, São Carlos, São Paulo, Brazil.


