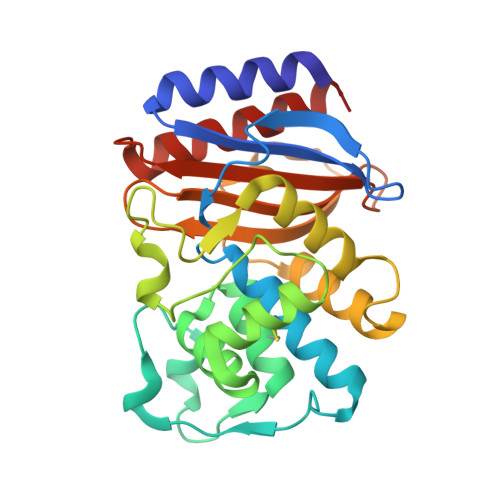
1NXY

Crystal Structure of the complex between M182T mutant of TEM-1 and a boronic acid inhibitor (SM2)


Experimental Data Snapshot

  • Method: X-RAY DIFFRACTION
  • Resolution: 1.60 Å
  • R-Value Free: 0.196 
  • R-Value Work: 0.172 

Starting Model: experimental
View more details

wwPDB Validation   3D Report Full Report


Ligand Structure Quality Assessment 


This is version 1.5 of the entry. See complete history


Literature

Recognition and Resistance in TEM beta-lactamase

Wang, X.Minasov, G.Blazquez, J.Caselli, E.Prati, F.Shoichet, B.K.

(2003) Biochemistry 42: 8434-8444

  • DOI: https://doi.org/10.1021/bi034242y
  • Primary Citation of Related Structures:  
    1NXY, 1NY0, 1NYM, 1NYY

  • PubMed Abstract: 

    Developing antimicrobials that are less likely to engender resistance has become an important design criterion as more and more drugs fall victim to resistance mutations. One hypothesis is that the more closely an inhibitor resembles a substrate, the more difficult it will be to develop resistant mutations that can at once disfavor the inhibitor and still recognize the substrate. To investigate this hypothesis, 10 transition-state analogues, of greater or lesser similarity to substrates, were tested for inhibition of TEM-1 beta-lactamase, the most widespread resistance enzyme to penicillin antibiotics. The inhibitors were also tested against four characteristic mutant enzymes: TEM-30, TEM-32, TEM-52, and TEM-64. The inhibitor most similar to the substrate, compound 10, was the most potent inhibitor of the WT enzyme, with a K(i) value of 64 nM. Conversely, compound 10 was the most susceptible to the TEM-30 (R244S) mutant, for which inhibition dropped by over 100-fold. The other inhibitors were relatively impervious to the TEM-30 mutant enzyme. To understand recognition and resistance to these transition-state analogues, the structures of four of these inhibitors in complex with TEM-1 were determined by X-ray crystallography. These structures suggest a structural basis for distinguishing inhibitors that mimic the acylation transition state and those that mimic the deacylation transition state; they also suggest how TEM-30 reduces the affinity of compound 10. In cell culture, this inhibitor reversed the resistance of bacteria to ampicillin, reducing minimum inhibitory concentrations of this penicillin by between 4- and 64-fold, depending on the strain of bacteria. Notwithstanding this activity, the resistance of TEM-30, which is already extant in the clinic, suggests that there can be resistance liabilities with substrate-based design.


  • Organizational Affiliation

    Department of Pharmaceutical Chemistry, University of California San Francisco, Genentech Hall, San Francisco, California 94143, USA.


Macromolecules
Find similar proteins by:  (by identity cutoff)  |  3D Structure
Entity ID: 1
MoleculeChains Sequence LengthOrganismDetailsImage
Beta-lactamase TEM263Escherichia coliMutation(s): 1 
Gene Names: bla
EC: 3.5.2.6
UniProt
Find proteins for P62593 (Escherichia coli)
Explore P62593 
Go to UniProtKB:  P62593
Entity Groups  
Sequence Clusters30% Identity50% Identity70% Identity90% Identity95% Identity100% Identity
UniProt GroupP62593
Sequence Annotations
Expand
  • Reference Sequence
Small Molecules
Ligands 2 Unique
IDChains Name / Formula / InChI Key2D Diagram3D Interactions
SM2
Query on SM2

Download Ideal Coordinates CCD File 
C [auth A],
D [auth A]
(1R)-1-(2-THIENYLACETYLAMINO)-1-(3-CARBOXYPHENYL)METHYLBORONIC ACID
C14 H14 B N O5 S
HQLQTGGLHBYZSA-ZDUSSCGKSA-N
K
Query on K

Download Ideal Coordinates CCD File 
B [auth A]POTASSIUM ION
K
NPYPAHLBTDXSSS-UHFFFAOYSA-N
Binding Affinity Annotations 
IDSourceBinding Affinity
SM2 PDBBind:  1NXY Ki: 64 (nM) from 1 assay(s)
Experimental Data & Validation

Experimental Data

  • Method: X-RAY DIFFRACTION
  • Resolution: 1.60 Å
  • R-Value Free: 0.196 
  • R-Value Work: 0.172 
  • Space Group: P 21 21 21
Unit Cell:
Length ( Å )Angle ( ˚ )
a = 73.625α = 90
b = 34.56β = 90
c = 105.36γ = 90
Software Package:
Software NamePurpose
DENZOdata reduction
SCALEPACKdata scaling
AMoREphasing
CNSrefinement

Structure Validation

View Full Validation Report


Ligand Structure Quality Assessment 


Entry History 

Deposition Data

Revision History  (Full details and data files)

  • Version 1.0: 2003-08-26
    Type: Initial release
  • Version 1.1: 2008-04-29
    Changes: Version format compliance
  • Version 1.2: 2011-07-13
    Changes: Version format compliance
  • Version 1.3: 2021-10-27
    Changes: Database references, Derived calculations
  • Version 1.4: 2023-08-16
    Changes: Data collection, Refinement description
  • Version 1.5: 2024-10-30
    Changes: Structure summary