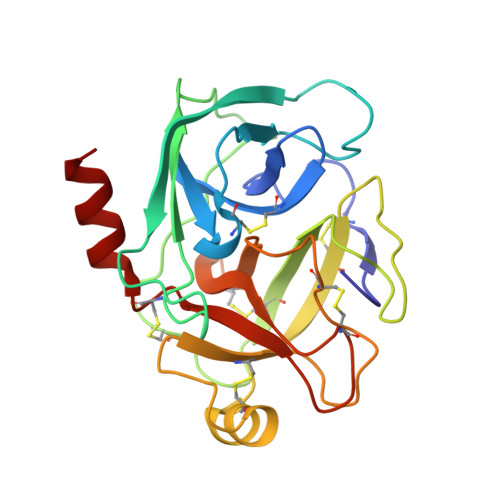
Elaborate Manifold of Short Hydrogen Bond Arrays Mediating Binding of Active Site-Directed Serine Protease Inhibitors
Katz, B.A., Elrod, K., Verner, E., Mackman, R.L., Luong, C., Shrader, W.D., Sendzik, M., Spencer, J.R., Sprengeler, P.A., Kolesnikov, A., Tai, V.W.-F., Hui, H.C., Breitenbucher, J.G., Allen, D., Janc, J.W.(2003) J Mol Biology 329: 93-120
- PubMed: 12742021
- DOI: https://doi.org/10.1016/s0022-2836(03)00399-1
- Primary Citation of Related Structures:
1O2G, 1O2H, 1O2I, 1O2J, 1O2K, 1O2L, 1O2M, 1O2N, 1O2O, 1O2P, 1O2Q, 1O2R, 1O2S, 1O2T, 1O2U, 1O2V, 1O2W, 1O2X, 1O2Y, 1O2Z, 1O30, 1O31, 1O32, 1O33, 1O34, 1O35, 1O36, 1O37, 1O38, 1O39, 1O3A, 1O3B, 1O3C, 1O3D, 1O3E, 1O3F, 1O3G, 1O3H, 1O3I, 1O3J, 1O3K, 1O3L, 1O3M, 1O3N, 1O3O, 1O3P - PubMed Abstract:
An extensive structural manifold of short hydrogen bond-mediated, active site-directed, serine protease inhibition motifs is revealed in a set of over 300 crystal structures involving a large suite of small molecule inhibitors (2-(2-phenol)-indoles and 2-(2-phenol)-benzimidazoles) determined over a wide range of pH (3.5-11.4). The active site hydrogen-bonding mode was found to vary markedly with pH, with the steric and electronic properties of the inhibitor, and with the type of protease (trypsin, thrombin or urokinase type plasminogen activator (uPA)). The pH dependence of the active site hydrogen-bonding motif is often intricate, constituting a distinct fingerprint of each complex. Isosteric replacements or minor substitutions within the inhibitor that modulate the pK(a) of the phenol hydroxyl involved in short hydrogen bonding, or that affect steric interactions distal to the active site, can significantly shift the pH-dependent structural profile characteristic of the parent scaffold, or produce active site-binding motifs unique to the bound analog. Ionization equilibria at the active site associated with inhibitor binding are probed in a series of the protease-inhibitor complexes through analysis of the pH dependence of the structure and environment of the active site-binding groups involved in short hydrogen bond arrays. Structures determined at high pH (>11), suggest that the pK(a) of His57 is dramatically elevated, to a value as high as approximately 11 in certain complexes. K(i) values involving uPA and trypsin determined as a function of pH for a set of inhibitors show pronounced parabolic pH dependence, the pH for optimal inhibition governed by the pK(a) of the inhibitor phenol involved in short hydrogen bonds. Comparison of structures of trypsin, thrombin and uPA, each bound by the same inhibitor, highlights important structural variations in the S1 and active sites accessible for engineering notable selectivity into remarkably small molecules with low nanomolar K(i) values.
- Celera, 180 Kimball Way, South San Francisco, CA 94080, USA. brad.katz@celera.com
Organizational Affiliation:


