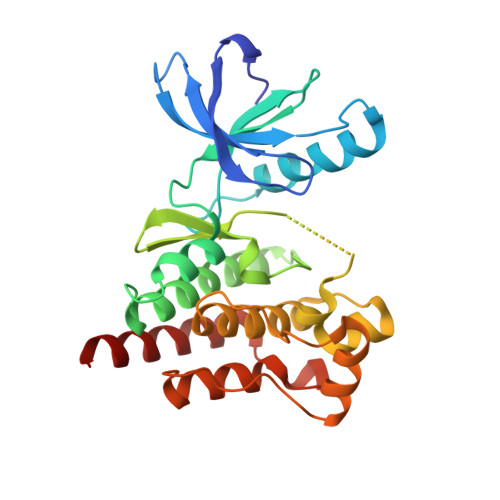
4D4S

Focal Adhesion Kinase catalytic domain


Experimental Data Snapshot

  • Method: X-RAY DIFFRACTION
  • Resolution: 2.00 Å
  • R-Value Free: 0.225 
  • R-Value Work: 0.206 
  • R-Value Observed: 0.207 

Starting Model: experimental
View more details

wwPDB Validation   3D Report Full Report


Ligand Structure Quality Assessment 


This is version 1.2 of the entry. See complete history


Literature

Allosteric Regulation of Focal Adhesion Kinase by Pip2 and ATP.

Zhou, J.Bronowska, A.Le Coq, J.Lietha, D.Grater, F.

(2015) Biophys J 108: 698

  • DOI: https://doi.org/10.1016/j.bpj.2014.11.3454
  • Primary Citation of Related Structures:  
    4D4R, 4D4S, 4D4V, 4D4Y, 4D55, 4D58, 4D5H, 4D5K

  • PubMed Abstract: 

    Focal adhesion kinase (FAK) is a nonreceptor tyrosine kinase that regulates cell signaling, proliferation, migration, and development. A major mechanism of regulation of FAK activity is an intramolecular autoinhibitory interaction between two of its domains--the catalytic and FERM domains. Upon cell adhesion to the extracellular matrix, FAK is being translocated toward focal adhesion sites and activated. Interactions of FAK with phosphoinositide phosphatidylinsositol-4,5-bis-phosphate (PIP₂) are required to activate FAK. However, the molecular mechanism of the activation remains poorly understood. Recent fluorescence resonance energy transfer experiments revealed a closure of the FERM-kinase interface upon ATP binding, which is reversed upon additional binding of PIP₂. Here, we addressed the allosteric regulation of FAK by performing all-atom molecular-dynamics simulations of a FAK fragment containing the catalytic and FERM domains, and comparing the dynamics in the absence or presence of ATP and PIP₂. As a major conformational change, we observe a closing and opening motion upon ATP and additional PIP₂ binding, respectively, in good agreement with the fluorescence resonance energy transfer experiments. To reveal how the binding of the regulatory PIP₂ to the FERM F2 lobe is transduced to the very distant F1/N-lobe interface, we employed force distribution analysis. We identified a network of mainly charged residue-residue interactions spanning from the PIP₂ binding site to the distant interface between the kinase and FERM domains, comprising candidate residues for mutagenesis to validate the predicted mechanism of FAK activation.


  • Organizational Affiliation

    Heidelberg Institute for Theoretical Studies, Heidelberg, Germany.


Macromolecules
Find similar proteins by:  (by identity cutoff)  |  3D Structure
Entity ID: 1
MoleculeChains Sequence LengthOrganismDetailsImage
FOCAL ADHESION KINASE 1
A, B
276Gallus gallusMutation(s): 0 
EC: 2.7.10.2
UniProt
Find proteins for Q00944 (Gallus gallus)
Explore Q00944 
Go to UniProtKB:  Q00944
Entity Groups  
Sequence Clusters30% Identity50% Identity70% Identity90% Identity95% Identity100% Identity
UniProt GroupQ00944
Sequence Annotations
Expand
  • Reference Sequence
Small Molecules
Ligands 3 Unique
IDChains Name / Formula / InChI Key2D Diagram3D Interactions
BI9
Query on BI9

Download Ideal Coordinates CCD File 
I [auth B]2-({5-CHLORO-2-[(2-METHOXY-4-MORPHOLIN-4-YLPHENYL)AMINO]PYRIMIDIN-4-YL}AMINO)-N-METHYLBENZAMIDE
C23 H25 Cl N6 O3
UYJNQQDJUOUFQJ-UHFFFAOYSA-N
SO4
Query on SO4

Download Ideal Coordinates CCD File 
C [auth A],
D [auth A],
F [auth B],
G [auth B]
SULFATE ION
O4 S
QAOWNCQODCNURD-UHFFFAOYSA-L
DMS
Query on DMS

Download Ideal Coordinates CCD File 
E [auth A],
H [auth B]
DIMETHYL SULFOXIDE
C2 H6 O S
IAZDPXIOMUYVGZ-UHFFFAOYSA-N
Binding Affinity Annotations 
IDSourceBinding Affinity
BI9 BindingDB:  4D4S IC50: min: 4.5, max: 5200 (nM) from 12 assay(s)
Experimental Data & Validation

Experimental Data

  • Method: X-RAY DIFFRACTION
  • Resolution: 2.00 Å
  • R-Value Free: 0.225 
  • R-Value Work: 0.206 
  • R-Value Observed: 0.207 
  • Space Group: P 1 21 1
Unit Cell:
Length ( Å )Angle ( ˚ )
a = 45.266α = 90
b = 124.877β = 94.33
c = 50.814γ = 90
Software Package:
Software NamePurpose
REFMACrefinement
XDSdata reduction
SCALAdata scaling
PHASERphasing

Structure Validation

View Full Validation Report


Ligand Structure Quality Assessment 


Entry History 

Deposition Data

Revision History  (Full details and data files)

  • Version 1.0: 2015-02-18
    Type: Initial release
  • Version 1.1: 2019-04-03
    Changes: Data collection, Other, Source and taxonomy
  • Version 1.2: 2023-12-20
    Changes: Data collection, Database references, Derived calculations, Other, Refinement description