


RCSB PDB Help
Sequence Viewers
Sequence Annotations in 3D
Introduction
What is the Sequence Annotations in 3D feature?
The Sequence Annotations in 3D feature maps protein sequence features (i.e., positions of interest in a protein sequence) onto the 3D structure of protein assemblies for visualization and analysis. This resource integrates structural information from the RCSB PDB and protein positional features (such as sites of mutation, catalytic residues, and secondary structural regions) from external resources including UniProt, CATH and SCOPe. The integrated information is displayed in two dynamically connected panels: the Mol* plugin displays the 3D structures of protein assemblies and the RCSB PDB PFV shows the protein sequence positional features.
When is the Sequence Annotations in 3D feature Useful?
This resource integrates 3D structural information of protein assemblies and positional features of protein sequences and presents it in two dynamically connected panels. You can use this resource to:
- Map protein positional features from its sequences onto 3D structures. The Sequence Annotations in 3D feature allows users to visualize protein positional features annotations from RCSB PDB, UniProt, CATH and SCOPe in 3D and explore neighboring structural features.
- Project 3D protein residues into graphical summaries of protein features in the protein sequence. This operation allows users to highlight protein residues of interest in the 3D structures to explore their local sequence annotations, integrated from various resources.
Documentation
Resource Interface
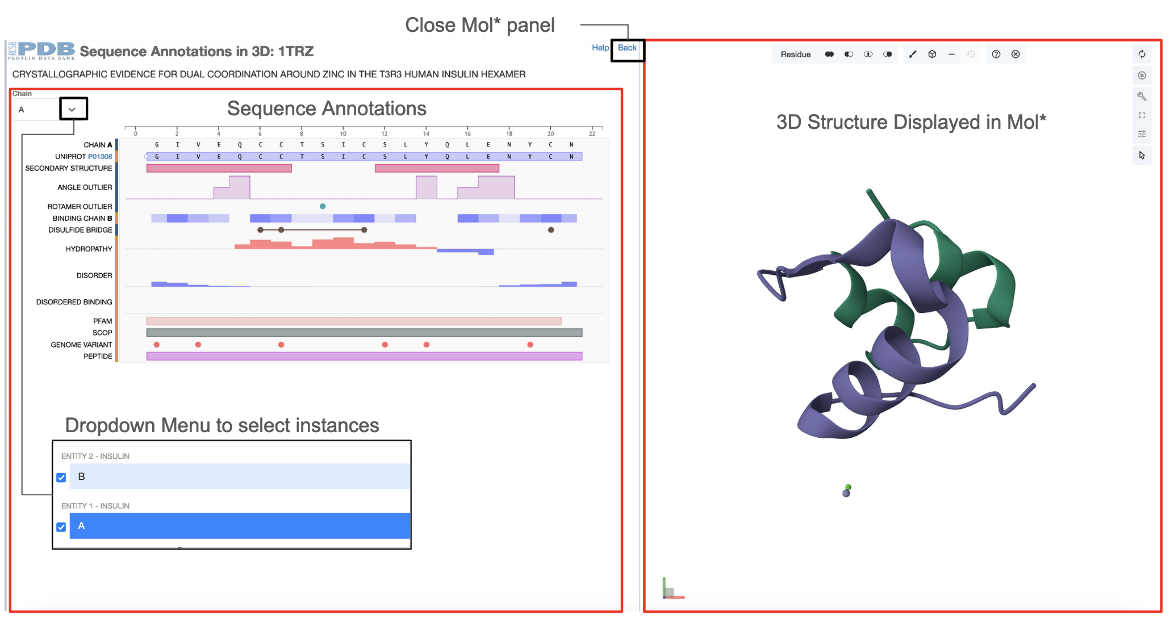
This feature is available from the Sequence Tab of the Structure Summary page of any 3D structure entry by clicking on the Explore Sequence Annotations in 3D link (e.g 1trz). Two dynamically connected panels display the integrated data - the Mol* plugin displays the structural information of protein assemblies and the RCSB PDB PFV shows the positional features of proteins (see Figure 1).
|
| Figure 1: Two dynamically connected panels showing the 3D structure and sequence annotations for the PDB entry 1trz. Options for selecting instances of protein chains to see positional annotations shown in inset. |
The following conventions are used for the two dynamically connected panels
- The sequence display panel:
- Displays positional features for a single protein.
- The drop down menu in the top left corner of the panel allows users to change the entity and explore its first instance in the current assembly
- Sequence Annotations documentation applies (link)
- The structure display panel:
- Displays the 3D structure of first assembly in the PDB entry in Mol*.
- Mol* UI can be used to explore the different assemblies that are available in the current PDB
- Mol* documentation applies (link)
- Both panels are dynamically connected so selecting/deselecting a region or residue in one of them will trigger the same selection/deselection in the other.
- When any positional feature is selected the sequence display panel, the residue or sequence range is highlighted in yellow rectangles and the same residues/features are selected in the structure display panel and highlighted in green.
- To close the 3D structure display click on "Back" on the top right corner of the sequence panel. This will take you back to the original view of the Sequence Annotations panel for that structure
How-To Navigate through the Resource
Structural mapping of sequence annotations/features
- Hovering over a positional feature in the sequence panel selects it in the structure panel and highlight it (in pink color) in the Mol* viewer
- To visualize a single amino acid of interest in the 3D structure
- Left click on a amino acid positional feature in the sequence panel to select and highlight the corresponding amino acid in the Mol* viewer.
- For the single residue selected the Mol* plugin will focus on it and display the atomic contacts in its environment
- To visualize more than one residue of interest in the 3D structure
- For selecting the first residue, left click on a Sequence Annotations positional feature to select and highlight it in the 3D structure in the Mol* viewer. Now hold the Shift key and left click on another positional feature in the sequence panel to add to the selection in the Mol* selection OR
- Right click on the sequence panel to select a single residue in the protein sequence. The residue will be highlighted and selected in the Mol* plugin. Now hold Ctrl and right click on additional residues to add to the current selection.
- To visualize a particular region of the protein sequence ( e.g., an alpha helix, beta strand, or SCOP/CATH domain)
- Right click and drag within the sequence panel to select the particular region of the protein sequence. This region will be highlighted and selected in the Mol* plugin. The selected positional feature is highlighted in yellow in the sequence panel while the corresponding 3D region selected in Mol* is zoomed in and highlighted in green.
- The regions may be alpha helices or beta strands, SCOP, PFam annotations of a domain etc.
- To clear selections
- In the sequence panel, double left click on the selected feature to clear all the selected region in the current chain. Note that this action will not clear any selections made in other chains
- In the 3D visualization panel, left click on an empty area in the Mol* 3D canvas will clear all the selected residues
- To change the PDB instances for which protein positional features are displayed
- The dropdown menu under "Instance" can be used to select the protein entity to explore
- The check boxes next to the chain IDs in the dropdown menu allow the user to hide or show the 3D chains in the Mol* plugin
Sequence projection of 3D structural feature selections
- Hovering over a residue in the Mol* plugin will highlight its location in the sequence panel only if the residue chain ID is the current selection in the dropdown menu
- To examine the sequence position of a residue selected in the structure
- Left click on a protein residue in the Mol* plugin and examine the residue highlighted in the sequence panel
- To examine the neighborhood of a ligand or ion displayed in the Mol* plugin
- Left click on the ligand or ion of interest. This will select all residues that are within 5Å of that position. The sequence positions of the selected residues are simultaneously highlighted in the sequence panel.
Examples
Structure mapping of sequence annotation
Focus on a zinc finger domain
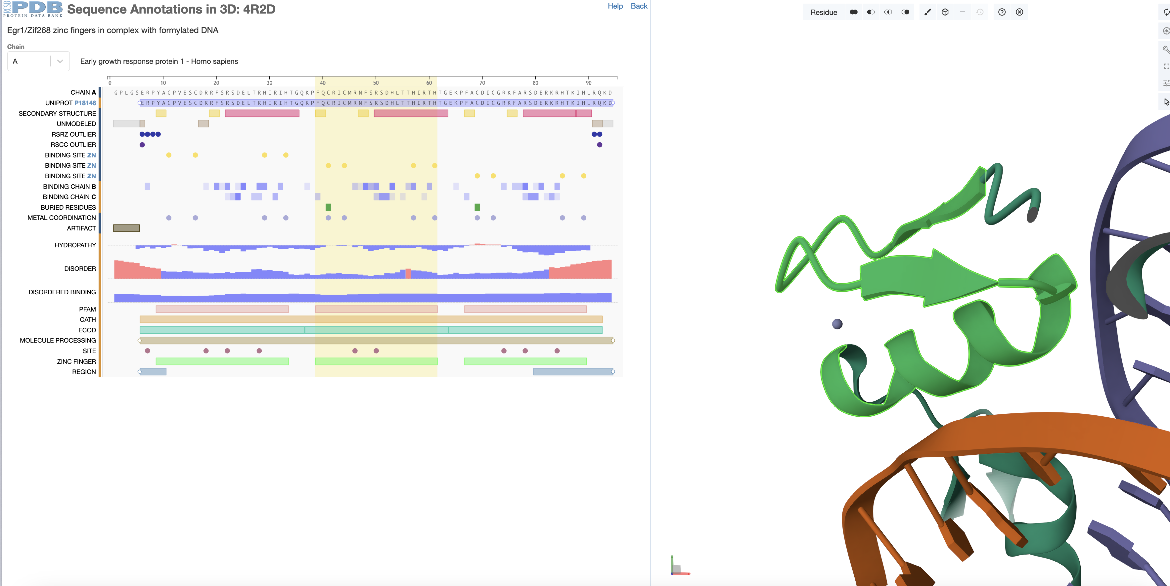
This example examines the second zinc finger domain of the PDB entry 4r2d.
In the sequence panel examine the annotations for the sequence of the first PDB entity (chain A) and select the 2nd zinc finger domain by clicking on the 2nd green rectangle at the bottom of the panel. This region corresponds to residues 39-61 (or 368-390 as per the author numbering) and is highlighted with a yellow rectangle spanning this sequence region. With selection of the sequence feature, the corresponding residues range is highlighted in green in the 3D structure, and Mol* zooms in, focusing and centering on this region (Figure 2).
|
| Figure 2: Focusing on the second zinc finger domain (a positional feature) in PDB ID 4r2d, selected from the sequence panel |
Interactions of a specific residue
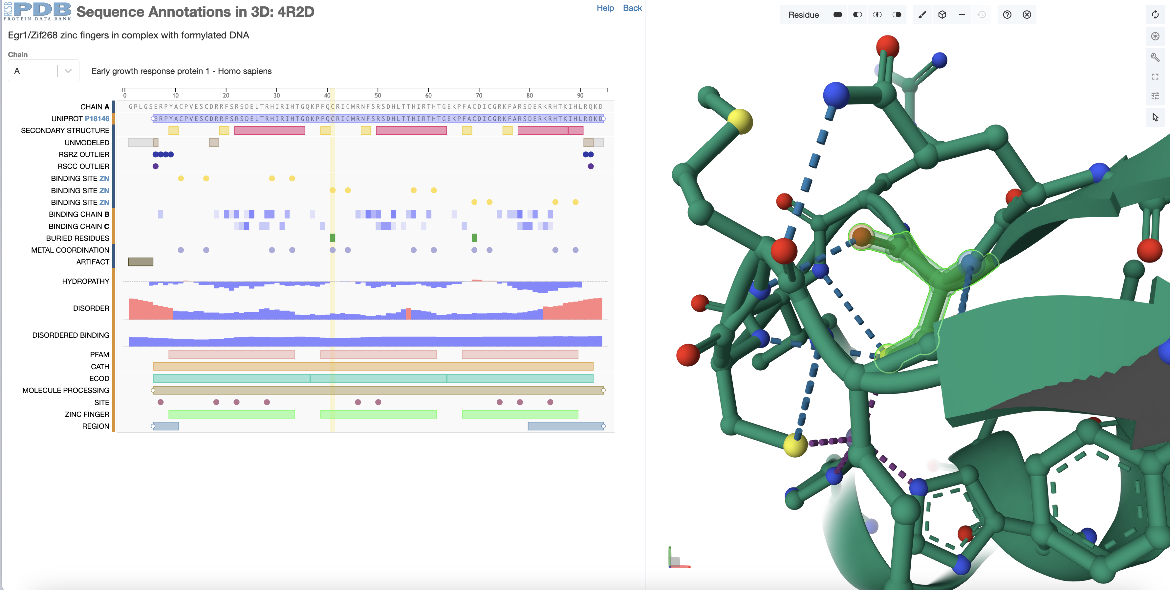
This example examines the 3D structural location of a single residue selected in the PDB entry 4r2d.
In the sequence panel examine the annotations and click on a residue marked as a zinc binding site in the second zinc finger domain (chain A, residue 41 or residue 370 by author numbering). The residue is highlighted with yellow rectangle in the sequence panel and the corresponding residue is highlighted in green in the 3D structure. In addition to focusing in on this residue in the Mol* panel it displays the non-covalent interactions within 5Å of the selected residue with dashed lines between interacting atoms (Figure 3).
|
| Figure 3: Selecting a single zinc binding amino acid in the second zinc finger domain of PDB ID 4r2d from the sequence panel and exploring its 3D environment. |
Adding residues to a selection
This example examines the 3D structural location of a group of residues selected in the PDB entry 4r2d.
Begin by selecting the first alpha helix (the one that is part of the first zinc finger domain) from the annotations in the sequence panel. In chain A this spans residues 22-35 (or residues 351-364 by the author numbering). To add one of the zinc binding residues in this zinc finger domain to the selection hold the shift key and click on the positional feature (e.g., residue 16 (or 345 by the author numbering)). This additional residue (or feature) is selected and highlighted in green in the 3D structure along with the first helix. If single residues are added to the selection, the Mol* will zoom into the last residue selected and display the non-covalent interactions in its environment. However, if additional regions are added to the selection they will just be selected and highlighted in green. Mol* functions may be used to display and analyze these regions (Figure 4).
|
| Figure 4: Selecting a specific positional features of PDB ID 4r2d from the sequence panel - 1 helix and a zinc binding amino acid. |
Sequence projection of structure selection
Environment of an ion/ligand
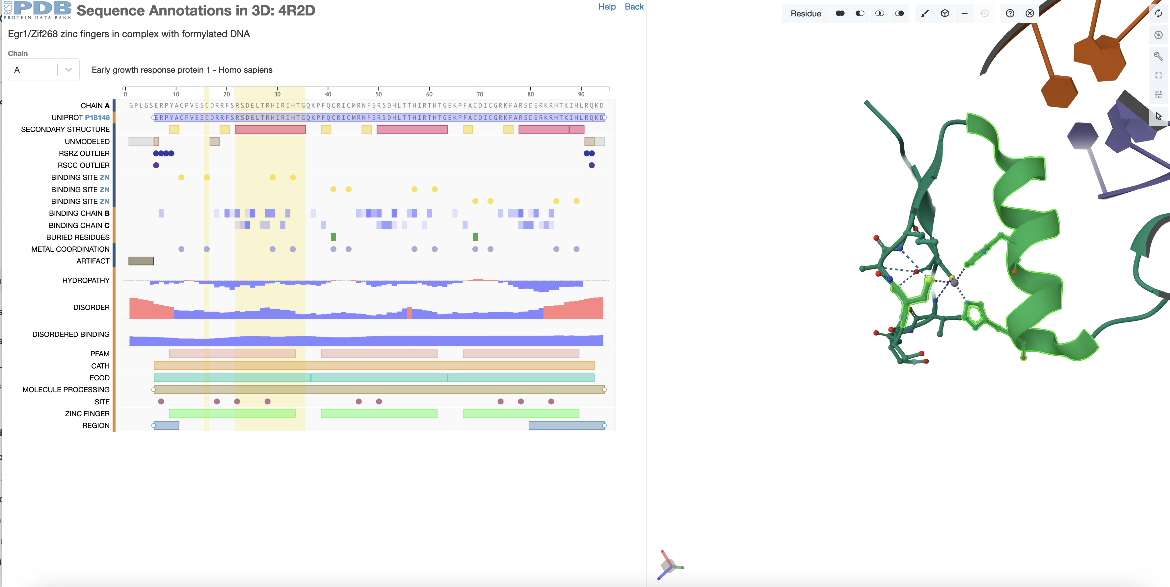
This example examines the sequence annotations of residues in the environment of a specific zinc ion in the PDB entry 4r2d.
In the 3D structure panel click on a zinc ion numbered 502 (author chain ID A) and all residues in 5Å of this zinc ion are selected in both the 3D structure and 1D sequence panel.
You can now expand Mol* to a fullscreen view to provide fine-grained control over the view and activate all the Mol* functions. Using these options you can display the side chains of these residues in ball-and-stick representation (Figure 5)
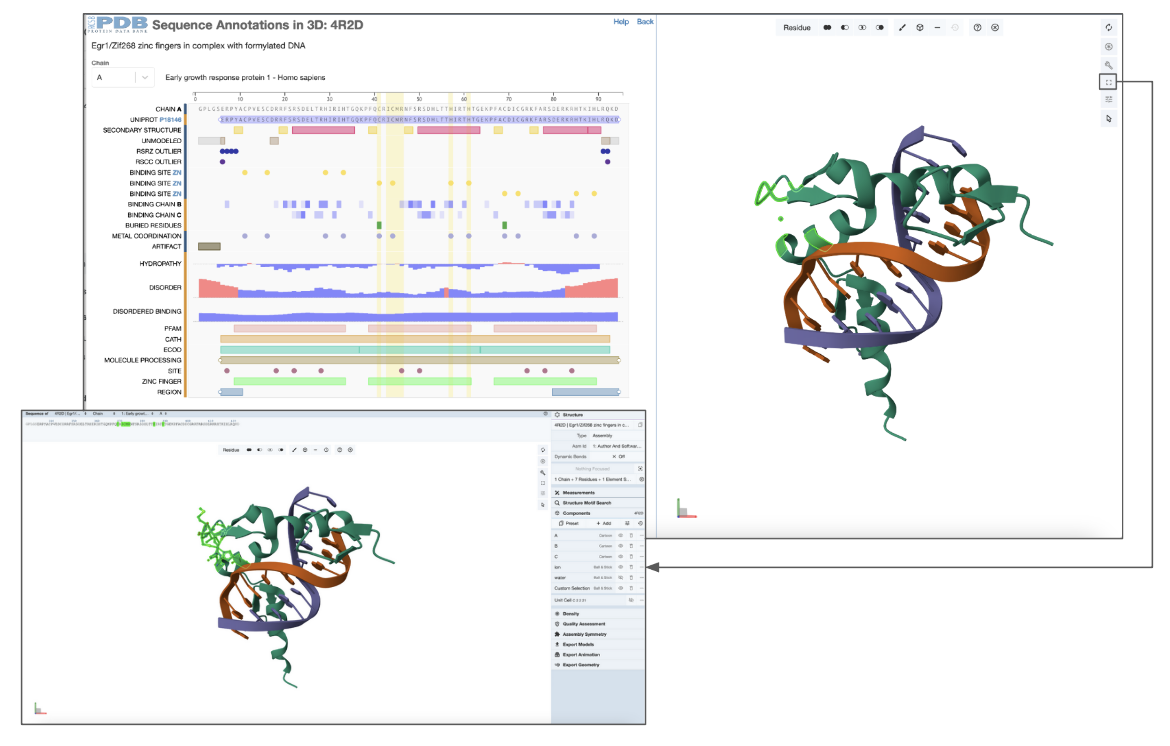
|
| Figure 5: Projecting the residues in the environment of a zinc ion in PDB ID 4r2d from the 3D structure to examine its sequence annotations. The inset shows fullscreen Mol* view generated from the Sequence Annotations in 3D feature's structure panel, by clicking on the button shown. |
For Developers
The Sequence Annotations Viewer (previously called Protein Feature Viewer) is an Open Source project written in TypeScript. It is available at github.com


