4YCU

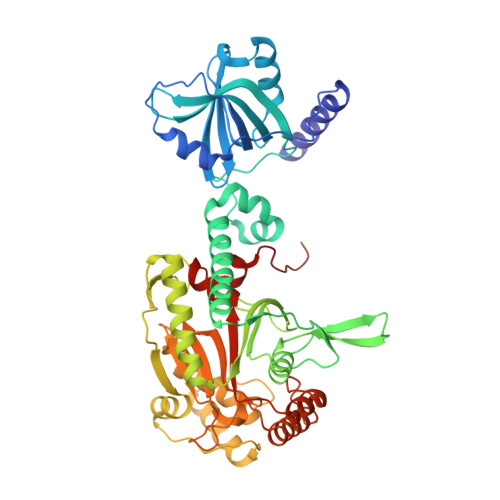
Crystal structure of cladosporin in complex with human lysyl-tRNA synthetase


Experimental Data Snapshot

  • Method: X-RAY DIFFRACTION
  • Resolution: 2.10 Å
  • R-Value Free: 0.213 
  • R-Value Work: 0.191 
  • R-Value Observed: 0.192 

wwPDB Validation   3D Report Full Report


Ligand Structure Quality Assessment 


This is version 1.4 of the entry. See complete history


Literature

Structural Basis for Specific Inhibition of tRNA Synthetase by an ATP Competitive Inhibitor.

Fang, P.Han, H.Wang, J.Chen, K.Chen, X.Guo, M.

(2015) Chem Biol 22: 734-744

  • DOI: https://doi.org/10.1016/j.chembiol.2015.05.007
  • Primary Citation of Related Structures:  
    4YCU, 4YCV

  • PubMed Abstract: 

    Pharmaceutical inhibitors of aminoacyl-tRNA synthetases demand high species and family specificity. The antimalarial ATP-mimetic cladosporin selectively inhibits Plasmodium falciparum LysRS (PfLysRS). How the binding to a universal ATP site achieves the specificity is unknown. Here we report three crystal structures of cladosporin with human LysRS, PfLysRS, and a Pf-like human LysRS mutant. In all three structures, cladosporin occupies the class defining ATP-binding pocket, replacing the adenosine portion of ATP. Three residues holding the methyltetrahydropyran moiety of cladosporin are critical for the specificity of cladosporin against LysRS over other class II tRNA synthetase families. The species-exclusive inhibition of PfLysRS is linked to a structural divergence beyond the active site that mounts a lysine-specific stabilizing response to binding cladosporin. These analyses reveal that inherent divergence of tRNA synthetase structural assembly may allow for highly specific inhibition even through the otherwise universal substrate binding pocket and highlight the potential for structure-driven drug development.


  • Organizational Affiliation

    Department of Cancer Biology, The Scripps Research Institute, Scripps Florida, 130 Scripps Way, Jupiter, FL 33458, USA. Electronic address: pfang@scripps.edu.


Macromolecules
Find similar proteins by:  (by identity cutoff)  |  3D Structure
Entity ID: 1
MoleculeChains Sequence LengthOrganismDetailsImage
Lysine--tRNA ligase
A, B
513Homo sapiensMutation(s): 0 
Gene Names: KARSKIAA0070
EC: 6.1.1.6 (PDB Primary Data), 2.7.7 (UniProt)
UniProt & NIH Common Fund Data Resources
Find proteins for Q15046 (Homo sapiens)
Explore Q15046 
Go to UniProtKB:  Q15046
PHAROS:  Q15046
GTEx:  ENSG00000065427 
Entity Groups  
Sequence Clusters30% Identity50% Identity70% Identity90% Identity95% Identity100% Identity
UniProt GroupQ15046
Sequence Annotations
Expand
  • Reference Sequence
Find similar proteins by:  (by identity cutoff)  |  3D Structure
Entity ID: 2
MoleculeChains Sequence LengthOrganismDetailsImage
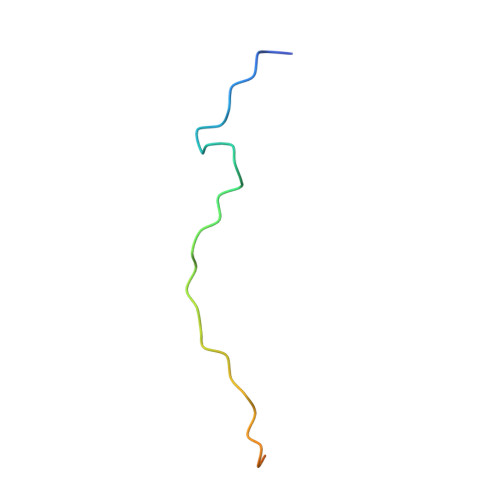
Aminoacyl tRNA synthase complex-interacting multifunctional protein 242Homo sapiensMutation(s): 0 
Gene Names: AIMP2JTV1PRO0992
UniProt & NIH Common Fund Data Resources
Find proteins for Q13155 (Homo sapiens)
Explore Q13155 
Go to UniProtKB:  Q13155
PHAROS:  Q13155
GTEx:  ENSG00000106305 
Entity Groups  
Sequence Clusters30% Identity50% Identity70% Identity90% Identity95% Identity100% Identity
UniProt GroupQ13155
Sequence Annotations
Expand
  • Reference Sequence
Small Molecules
Ligands 3 Unique
IDChains Name / Formula / InChI Key2D Diagram3D Interactions
KRS
Query on KRS

Download Ideal Coordinates CCD File 
D [auth A],
H [auth B]
cladosporin
C16 H20 O5
WOMKDMUZNBFXKG-ZWKOPEQDSA-N
LYS
Query on LYS

Download Ideal Coordinates CCD File 
E [auth A],
I [auth B]
LYSINE
C6 H15 N2 O2
KDXKERNSBIXSRK-YFKPBYRVSA-O
GOL
Query on GOL

Download Ideal Coordinates CCD File 
F [auth A],
G [auth A],
J [auth B],
K [auth B]
GLYCEROL
C3 H8 O3
PEDCQBHIVMGVHV-UHFFFAOYSA-N
Binding Affinity Annotations 
IDSourceBinding Affinity
KRS BindingDB:  4YCU IC50: min: 2.00e+4, max: 1.05e+5 (nM) from 2 assay(s)
Experimental Data & Validation

Experimental Data

  • Method: X-RAY DIFFRACTION
  • Resolution: 2.10 Å
  • R-Value Free: 0.213 
  • R-Value Work: 0.191 
  • R-Value Observed: 0.192 
  • Space Group: C 2 2 21
Unit Cell:
Length ( Å )Angle ( ˚ )
a = 96.194α = 90
b = 99.847β = 90
c = 268.987γ = 90
Software Package:
Software NamePurpose
PHENIXrefinement
HKL-2000data scaling
PDB_EXTRACTdata extraction
HKL-2000data reduction
MOLREPphasing

Structure Validation

View Full Validation Report


Ligand Structure Quality Assessment 


Entry History & Funding Information

Deposition Data


Funding OrganizationLocationGrant Number
National Institutes of Health/National Institute of General Medical Sciences (NIH/NIGMS)United StatesGM100136
National Institutes of Health/National Institute of General Medical Sciences (NIH/NIGMS)United StatesGM106134

Revision History  (Full details and data files)

  • Version 1.0: 2015-06-10
    Type: Initial release
  • Version 1.1: 2017-09-20
    Changes: Author supporting evidence, Derived calculations, Source and taxonomy
  • Version 1.2: 2018-10-10
    Changes: Data collection, Database references, Structure summary
  • Version 1.3: 2019-12-25
    Changes: Author supporting evidence, Structure summary
  • Version 1.4: 2024-11-20
    Changes: Data collection, Database references, Structure summary