


RCSB PDB Help
3D Viewers
NGL to Mol* UI Migration Guide
The visualization tool NGL, is no longer available as a molecular viewer option from RCSB.org Structure Summary Pages (Structure tab). Learn more about this.
We recommend that you use Mol* for 3D visualization. Learn how to perform common NGL functions in Mol* in the following sections.
Structure View
|
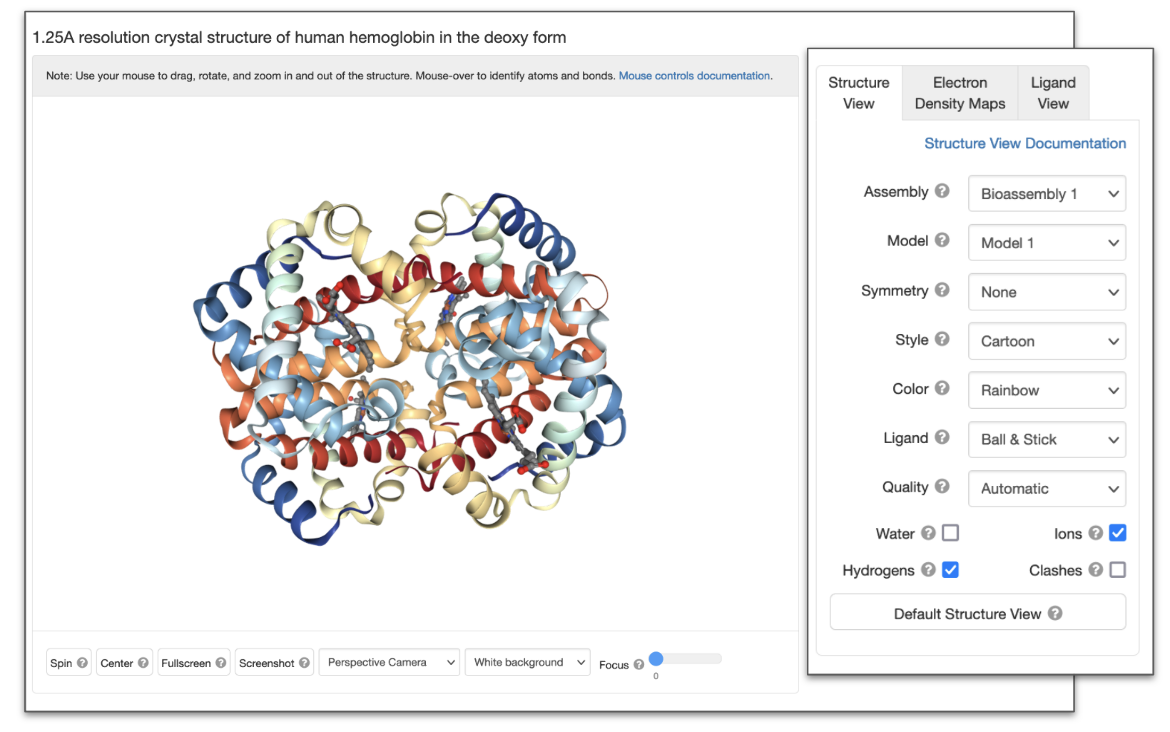
| Figure 1: NGL interface showing Structure View options |
| NGL Button/Options | Function performed | Equivalent function in Mol* |
|---|---|---|
| Assembly | View structure as asymmetric unit, biological assembly, unit cell, or supercell (stacked unit cells) | Switch between different models and biological assemblies for display in the 3D canvas |
| Model | View specific model for multi-model structure | Select specific models from an ensemble |
| Symmetry | View intrinsic molecular symmetry. | View molecular symmetry using the assembly symmetry panel |
| Style | View the structure in different representation styles (Backbone, Surface, Cartoon, Spacefill/CPK, Licorice, Line, and Ball & Stick) | Change representation of the structure |
| Color | Color the structure using different color schemes e.g., By Chain, Element/CPK, Rainbow, Secondary Structure etc. | Steps to color all or parts of the structure by chain, element/CPK, rainbow/spectrum color scheme, secondary structure etc. |
| Ligand | Change the ligand representation style -- ligands can be displayed as ball-and-stick, space fill or turned off | Change representation of the structure |
| Quality | Adjust the rendering quality. When creating screenshots, set this option to 'high' for the best results | Select appropriate resolution when taking screenshots. |
| Water | Show or hide water molecules present in the structure | Select specific parts of a structure to show or hide it |
| Ions | Show or hide ions present in the structure | Select specific parts of a structure to show or hide it |
| Hydrogens | Show or hide hydrogen atoms included in the structure | Show or hide hydrogen atoms |
| Clashes | Show or hide clashes between atoms (indicated by pink disks) as given in the Validation Report | View structure quality using the quality assessment panel |
Electron Density Maps
|
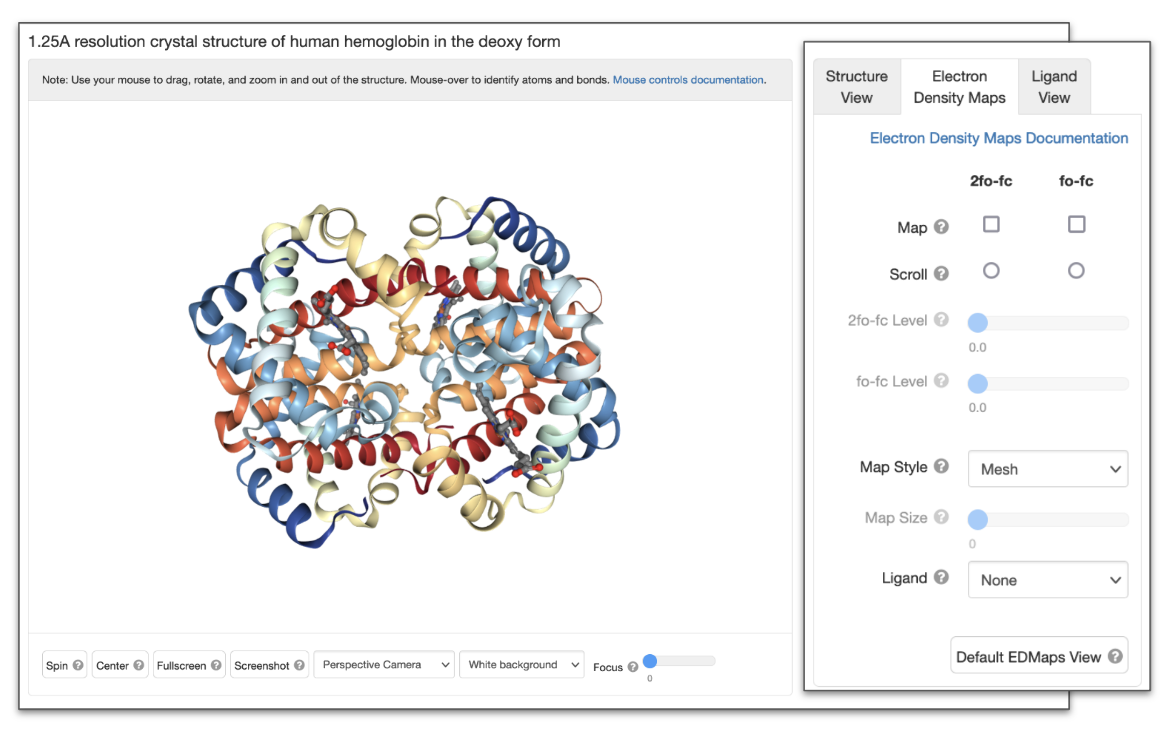
| Figure 2: NGL interface showing Electron Density Maps options |
| NGL Button/Options | Function performed | Equivalent function in Mol* |
|---|---|---|
| Map | Select and turn on the map(s) displayed - 2fo-fc map (colored blue), fo-fc map (negative density is colored red and positive peaks are colored green) | Display the Electron Density map by activating the Density Panel. |
| Scroll | Select the map whose isodensity level value will be changed with the mouse via "Ctrl scroll-wheel" | The 2Fo-Fc and Fo-Fc level sliders in the Density Panel. |
| Level | The value at which the isosurface of the map is shown (in sigma values). This value can be adjusted using the sliders for each map type or using the mouse via "Ctrl scroll-wheel" | The 2Fo-Fc and Fo-Fc level sliders in the Density Panel. |
| Map Style | Select the map display style (mesh, smooth, or flat) | The default option for displaying the electron density map corresponds to the Smooth style. The wireframe option is equivalent to the mesh style (see Density Panel). |
| Map Size | For efficiency, only a portion of the map is displayed. The map size option adjusts the size (in Å along each of the three crystallographic axes) of this portion | Activate the electron density display using options in the Density Panel and use the sliders to focus around a specific area. |
| Ligand | Recenter the view around the selected ligand | Click on the “Interactions and Density” button in the Small Molecules section, 3D interaction column to view the electron density map around the selected ligand and polymer chain. |
Ligand View and Options
|
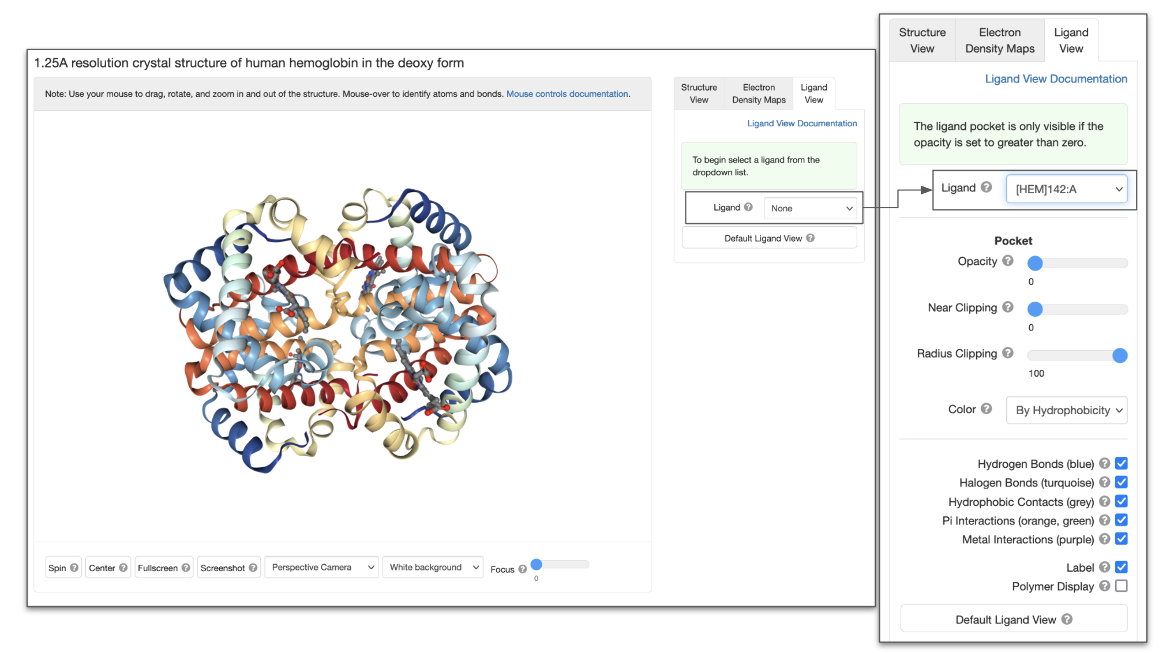
| Figure 3: NGL interface showing Ligand View. The panel on the right shows the options that become available when a specific ligand is selected. |
| NGL Button/Options | Function performed | Equivalent function in Mol* |
|---|---|---|
| Ligand | Select the ligand to display and view the ligand and interactions in its neighborhood. | Display the interactions of a ligand with amino acids and ligands in its neighborhood. |
| Opacity | Change the opacity of the ligand binding pocket | Display the hydrophobicity on the surface of the ligand binding pocket Change the Opacity of the surface as needed |
| Near Clipping | Adjust the clipping plane for the ligand binding pocket | Use Clip Planes to slice through and refine the view being displayed |
| Radius Clipping | Change the radius of the clipping sphere around the ligand binding pocket | Currently a binding pocket of 5 Å can be displayed around a selected ligand or custom residue selection. Additional coding is needed to display binding pockets of a custom radius. |
| Color | Color the pocket surface using different schemes (element/CPK, hydrophobicity, and B-factor) | Once you have drawn the binding pocket surface, you can change the color of the surface by selecting appropriate Color options. |
| Interactions | Show or hide various interactions (Hydrophobic Contacts, Hydrogen Bonds, Halogen Bonds, Metal Interactions, Pi Interactions) | Select the types of non-covalent interactions displayed when viewing the interactions in the neighborhood of a selected amino acid or ligand. |
| Label | Display or hide labels for the ligand and neighboring residues | Label any atom, ligand, or residue (amino acid or nucleotide) selected |
| Polymer Display | Show or hide the current polymer display | Show or hide any atom, ligand, or residue (amino acid or nucleotide) selected |
Common Actions for Structure Displayed
|
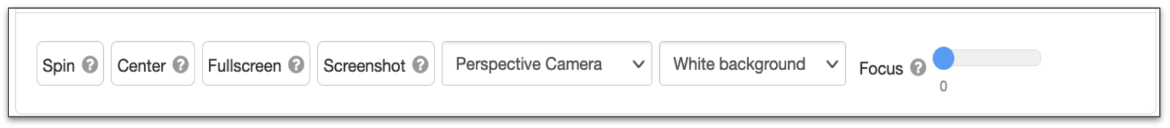
| Figure 4: Options in NGL to manipulate the display of molecule(s) loaded in the tool |
| NGL Button/Options | Function performed | Equivalent function in Mol* |
|---|---|---|
| Spin | Start/stop spinning the structure along Y-axis | Use Keyboard Controls - e.g., key “i” |
| Center | Reset molecule position | See option button in the General Interface toggle menu in or use the Keyboard Controls - e.g., key “t” |
| Fullscreen | Activate/disable fullscreen mode | Use the Extend Viewport option in the General Interface toggle menu |
| Screenshot | Download screenshot (at twice the displayed resolution) | Take Screenshots to save images. |
| Camera | Perspective or Orthographic | Select Camera options |
| Background | White or Black | Change the Background color |
| Focus | Slides to move far and near clipping planes towards the center | Change the camera Focus and center of rotation on specific atoms, residues, or parts of structures. |
Please report any encountered broken links to info@rcsb.org
Last updated: 7/1/2024


