


RCSB PDB Help
General Help
Assessing the Quality of 3D Structures
Introduction
Both experimentally determined (PDB) structures and computed structure models (CSMs) are available from RCSB.org. While high quality experimentally-determined structures are more reliable than computed structure models, both experimental structures and CSMs are created based on assumptions, have limitations, and are imperfect. To make the best use of any model it is important to be aware of its quality. Available quality assessment measures are discussed herein, together with how to interpret and use these measures for identifying suitable models to meet specific visualization and analysis needs.
What are biomolecular structures used for?
The 3D structures available from RCSB.org are used to visualize and analyze the shapes of these molecules to provide:
- insights into intra- and inter-molecular interactions, function, and evolution
- a foundation for developing hypotheses to explain observations and data
- a visual framework for designing new properties and functions by building on an understanding of structure-function relationships (e.g., understanding diseased states and designing new therapeutic approaches).
Why is it important to learn about biomolecular structure quality?
The quality assessment of a structure should be factored into any visualization and/or analysis. Before embarking on detailed analyses, predictions, and/or molecular design work, it is important to know which parts of the 3D structure are determined with a high level of confidence and which parts should not be relied upon. There are various possible reasons why all or part of a 3D model might have limited reliability.
- Limitations of experimental structures may include
- mismatches between the model and the experimental data due to errors made in construction of the model
- lack of experimental data in specific regions of the model due to disorder or movement in those regions
- distortions in atomic geometry, e.g., deviations in bond lengths, bond angles, or dihedral angles or clashes between atoms due to errors in model building and/or refinement
- Limitations of CSMs may include
- regions of low confidence in the model due to limitations of the data that support predictions in that part of the molecule
- regions where there is a conflict between the CSM and one or more experimental structures archived in the PDB
Whenever an experimental structure of a molecule of interest is available, it should be used for visualization and analysis. It is also recommended that the accuracy of all 3D models is reviewed, both at the level of the overall structure and especially for the parts that are relevant to the specific structural and/or functional detail(s) being studied.
Documentation
What biomolecular structure quality measures are available?
All experimental structures available from RCSB.org are validated based on recommendations from the expert Validation Task Forces (VTF) for X-ray (Read et al., 2011), NMR (Montellione et al., 2013), and EM (Hendersen et al., 2012).
CSMs available from RCSB.org are presented with a commonly used model confidence measure - called the predicted Local Distance Difference Test (pLDDT) - to indicate how well the predicted structure is supported by sequence and reference structure data. Learn more about CSMs and pLDDT scores.
Quality assessment measures for all 3D structures may be broadly grouped into two categories:
- agreement with structure determination data
- agreement with known stereochemistry
While experimental structures are determined using data collected during X-ray crystallography, NMR, or 3DEM experiments, CSMs are computed based on sequence data and knowledge of protein structures. Specific measures in each of these categories that can be examined to assess structure quality are discussed here.
Agreement with Structure Determination Data
X-ray Crystallography Structures
The vast majority of experimental structures (~87% of the PDB archive as of August 2022) were determined using X-ray crystallography. For all structures deposited since 2008 (and a majority of structures deposited before that), the experimental data used for structure determination (structure factor files) are available in the archive for download and can be used for structure quality assessment. Some of the key measures commonly used to assess the quality of structures determined by this method include
- Resolution - This is a measure of overall structure quality and indicates how well two adjacent atoms in the structure can be distinguished. Lower values represent better resolution, e.g., a 1.8 Å structure has a better resolution than a 3 Å structure. This measure does not highlight regions of local disorder or limited structure quality. Learn more about structure resolution.
- R-factor - This is another measure of overall structure quality that describes the agreement between the experimental diffraction data and simulated experimental data calculated based on the 3D model of the biomolecule. Perfect agreement between the two (a theoretical scenario, never true in practice) would yield a zero R-factor, so lower numbers (e.g., 0.2 or 20%) indicate better agreement. To avoid over-interpretation of the experimental data in model building, an unbiased R-factor called R-free was introduced (Brunger 1992) to measure how well the 3D model agrees with a “test set” of the experimental data that was not used during structure determination. Commonly the R-free value is just a little (~0.05, or ~5%) higher than the R-factor. So when the R-factor is 0.2, the R-free is likely to be 0.25. A large difference between R-factor and R-free may indicate errors in the model. Learn more about R-value and R-free.
- Real Space R (RSR) value - This is a measure of how well each residue in the 3D atomic model matches the experimental data locally in real space (Jones et al., 1991). A lower value indicates better local fitting. A related measure called the RSR Z-score (or RSRZ) (Kleywegt et al., 2004) is included in the X-ray validation reports. Learn more about X-ray validation reports.
Another measure, Real-Space-Correlation-Coefficient (RSCC), reflects agreement between 3D atomic coordinates and experimental electron density of over 100 million individual amino acid residues in PDB structures (Shao et al., 2022). Higher values indicate better agreement and lower values worse agreement. RSCC distributions for each type of standard amino acid were analyzed as a function of resolution limit and ranked from lowest to highest values, indicating worse to better experimental data support for the atomic coordinates of each residue. Atomic coordinates of poorly-resolved residues with RSCC in the lowest 1% should not be trusted, while the residues with RSCC between the lowest 1% and 5% should be considered with caution. RSCC-based outlier identification is statistically sound and cross-examined, and therefore is the preferred method to review local structural confidence in terms of experiment support.
Nuclear Magnetic Resonance (NMR) Structures
NMR structures represent ~7% of the total experimental structures archived in the PDB (as of August 2022). For NMR structures in the PDB archive, experimental data such as chemical shifts (available since 2010) and restraints (available since 2008), are available for download separately and/or as a single file either in NMR-STAR or in NMR exchange format (NEF). Learn more about the NEF format. Quality measures assessing agreement of NMR structures with experimental data focus on
- Chemical Shift Validation - Chemical shifts are resonant frequencies of atomic nuclei in a magnetic field relative to a standard and are dependent upon the chemical environment of the nucleus. Chemical shift analysis helps the referencing of specific nuclei, e.g., Cα, Cβ, C' and N, in the structure and in assessment of resonance assignment completeness. Any statistically unusual chemical shifts should be carefully assessed to determine if they represent truly strained conformations in the molecule or resonance assignment errors.
- Random Coil Index (RCI) is a measure calculated for each protein residue based on its measured chemical shifts and the primary sequence of the protein chain (Berjanskii and Wishart, 2005). Higher values indicate higher probability that the given residue is “random coil-like” or disordered. Learn more about NMR Chemical Shifts validation.
- Restraints Violations are computed for all conformationally restricting restraints and validated against each model in the NMR ensemble. Geometric and conformational restraints derived from NMR data are critical for structure determination. Distance restraints such as NOEs, hydrogen bond restraints, disulfide bond restraints, conformational restraints derived from chemical shifts and J-couplings, and dihedral angle restraints are examined. If the measured distance in a model is significantly different from a restraint, the absolute difference between the two is reported as the violation value. Learn more about NMR validation reports.
3D Electron Microscopy (3DEM) Structures
Structures determined using 3DEM represent only ~6% of experimental structures in the PDB (as of August 2022). However, 3DEM is rapidly gaining popularity for being able to study shapes and interactions of molecules within very large complexes and assemblies. The primary experimental data (EM density maps) are archived at EMDB and also made available from the EMDataResource. Not all EM maps have had models built into them, and some models may represent only portions of an EM map. Currently, validation reports are available for the EM model, EM map only, and EM tomogram.The quality of the EM models may be assessed using the following measures:
- Resolution: A Fourier-Shell Correlation (FSC) method is used to estimate the resolution for single particle and subtomogram averaged structures (van Heel et al., 2000).
- Map-Model Fit: The following measures are included in EM validation reports to assess the match between the EM map and model coordinates:
- Visual overlays of EM maps and associated 3D models can be used to identify regions of mismatch.
- Atom inclusion is a measure of the fraction of atoms in the model that are inside the EM volume - both overall and per-residue atom inclusion fractions are reported in validation reports. For a given contour level, atom inclusion graphs display the fraction of backbone atoms and all atoms are inside the volume defined by the EM maps.
- Q-score: This score uses a real-space correlation approach to assess how well atoms in the structure can be resolved. Q-scores (Pintilie et al., 2022) can be calculated for protein and nucleic acid atoms, waters, ions etc. using models fitted to or derived from cryo-EM maps. Average Q-scores over several atoms may be computed for larger features, e.g., amino acid residues and nucleotides or the complete model. Learn more about inclusion of Q-scores in EM validation.
Learn more about EM validation reports.
Computed Structure Models available from RCSB.org
The ~1 million CSMs (as of August 2022) integrated into RCSB.org were either computed by AlphaFold2 (Jumper et al., 2021) or a combination of RoseTTAFold and AlphaFold2 (Humphreys et al., 2021). While there is no direct experimental data for these predicted structures, they are based on extensive sequence alignment and 3D reference model data. Convergence of the 3D model and supporting data provides a confidence measure in these models.
- Predicted Local Distance Difference Test (pLDDT): AlphaFold2 provides both a global and residue-level measure that estimates how well the computationally predicted structure agrees with multiple sequence alignment data and PDB structure information used to compute the model. The pLDDT score (Tunyasuvunakool, et al., 2021) ranges between 0 and 100. While regions with high pLDDT values (≥70) indicate regions that are predicted with confidence, regions with low pLDDT scores generally indicate low confidence. Sometimes low pLDDT scores can predict regions of protein disorder (Ruff and Pappu, 2021) and/or intrinsically-disordered regions (IDRs) of proteins (Necci et al., 2021). Learn more about CSMs and pLDDT scores.
Agreement with known Stereochemistry
Regardless of the method of structure determination, shapes and interactions of biomolecules are defined by (a) chemical properties of atoms in the molecule and (b) how these atoms are positioned in 3D. 3D model geometry is used to determine the nature of covalent and non-covalent interactions between atoms. Any distortions in the following are worth noting since they may indicate limitations in the model.
- Bond lengths: when bonds between atoms are either too short or too long they should be examined carefully, especially if the distortion is not supported by experimental or other data.
- Bond angles: distortions in bond angles between atoms in a biomolecule may also indicate errors in model building and/or refinement.
- Torsion angles: deviations in torsion angles indicate conformational changes in biopolymer structures, such as those defining the polymer (protein or nucleic acid) backbone, amino acid side chains, sugars, bases, and their various modifications. Ramachandran and other torsion angle plots specify torsion angle values that are commonly seen in structures. Outliers in these plots should be examined carefully.
Accessing and interpreting biomolecular structure quality measures
The RCSB PDB provides information about structure quality in a variety of formats. Depending on the type of structure and the specific questions being asked about it, several of these reports and quality measures should be examined. The crystal structure of a beta-glucuronidase from Acidobacterium capsulatum (PDB ID 7psj) is used here to illustrate various structure quality assessment measures, where to find them, and how to interpret them.
Note that the models of older structures or structures determined at low resolution may not be as highly optimized and may show issues with some measures. The quality measures allow users to identify potential problems and assess their impact when used.
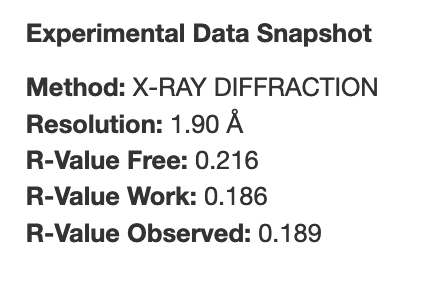
A. Measures such as resolution, R-value, R-free, etc. can be found from the Structure summary page - see header.
For example, the resolution of PDB entry 7s98 is 1.9 Å, R-value is 0.186, and the R-free value is 0.216 (see Figure 1). Based on these measures, the overall quality of this structure is high.
|
| Figure 1: Experimental Data Snapshot of PDB ID 7s98, displaying overall structure quality measures. |
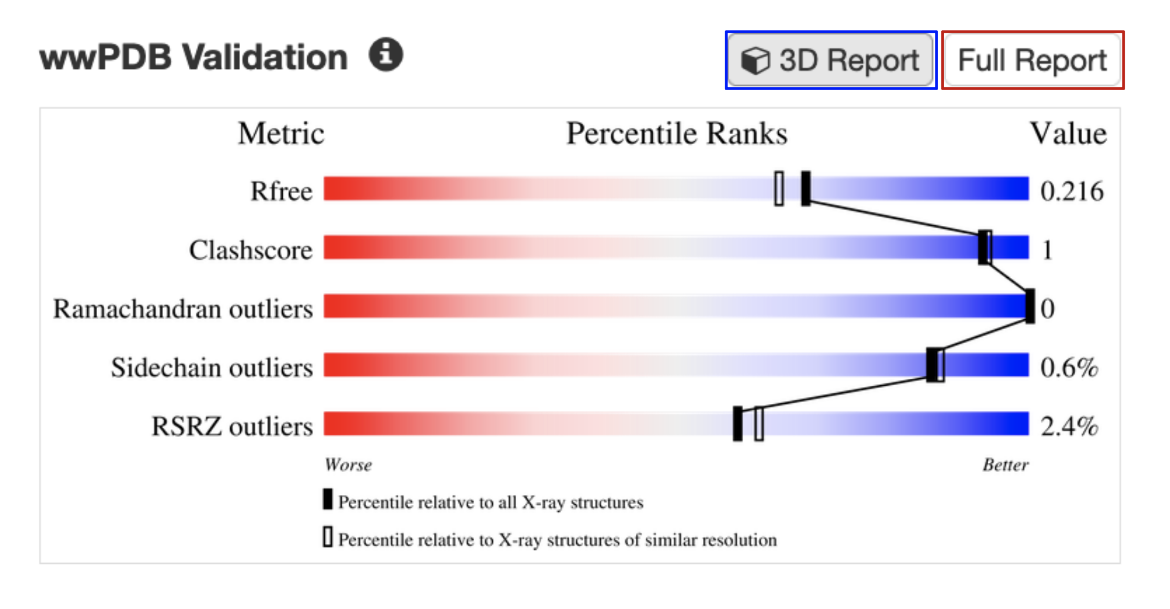
B. Validation slider: All experimental structures in RCSB.org display their overall quality at a glance in the form of a validation slider, available from the Structure Summary page (Figure 2). Different structure quality assessment criteria (e.g., Rfree, Clashscore, Ramachandran Outliers) are presented in different rows of the slider. The specific value of quality measure for the structure is shown as a vertical bar in the slider. The quality is assessed based on whether the vertical bar is closer to the red (worse) or blue (better) end of the slider. Structures with values in the blue range conform better to expected values for conformational parameters and fit of model to experimental data, whereas structures in the red range may have issues such as regions with weak experimental support or a less optimized model. Learn more about the validation slider.
The validation slider for the PDB entry 7s98 is shown here (Figure 2). Bars representing the R-free, clashscore, Ramachandran outliers, Sidechain outliers, and RSRZ outliers for the structure shown in this example (PDB entry 7s98) are mostly towards the blue or better end of the slider. This suggests that the structure is well determined and reliable.
|
| Figure 2: Validation slider for the PDB entry 7s98, with links to access the full validation report (red box) and a colored display of key geometric issues in 3D (blue box). |
In contrast, the validation slider for the same protein without any ligand bound (PDB entry 7s8z) has higher overall resolution but worse quality based on the validation slider.
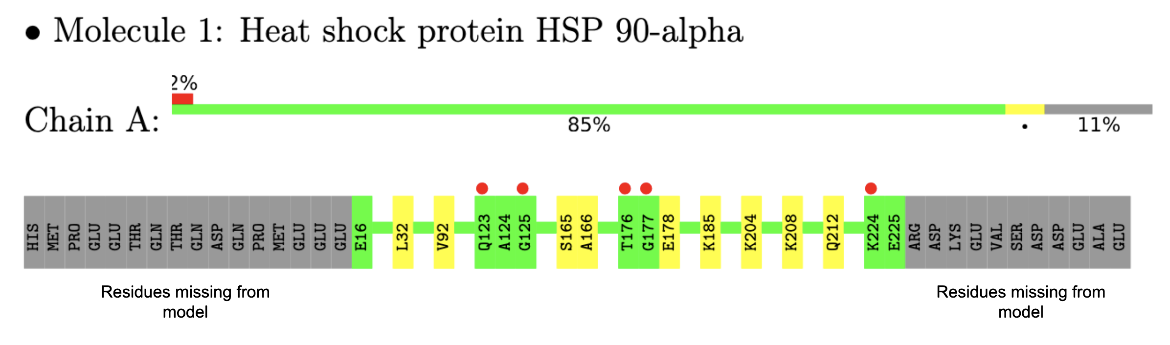
C. Validation report: Detailed reports describing overall structure quality and residue level listings of geometry distortions and mismatches with experimental data are available in various formats from the structure summary pages of each structure. Learn more about wwPDB validation reports for all types of experimental structures.
In the example here, a sample of residue level linear map of geometry and electron density mismatch issues listed in the validation report for PDB entry 7s98 is shown (see Figure 3). Note that there are no major geometry issues with any of the amino acid residues in this structure, but there are a number of amino acids in the sequence that were not modeled (perhaps due to limited quality of the electron density maps in that region).
|
| Figure 3: Residue level mapping of geometry and electron density issues in one of the protein chains (Chain A) in the PDB entry 7s98 |
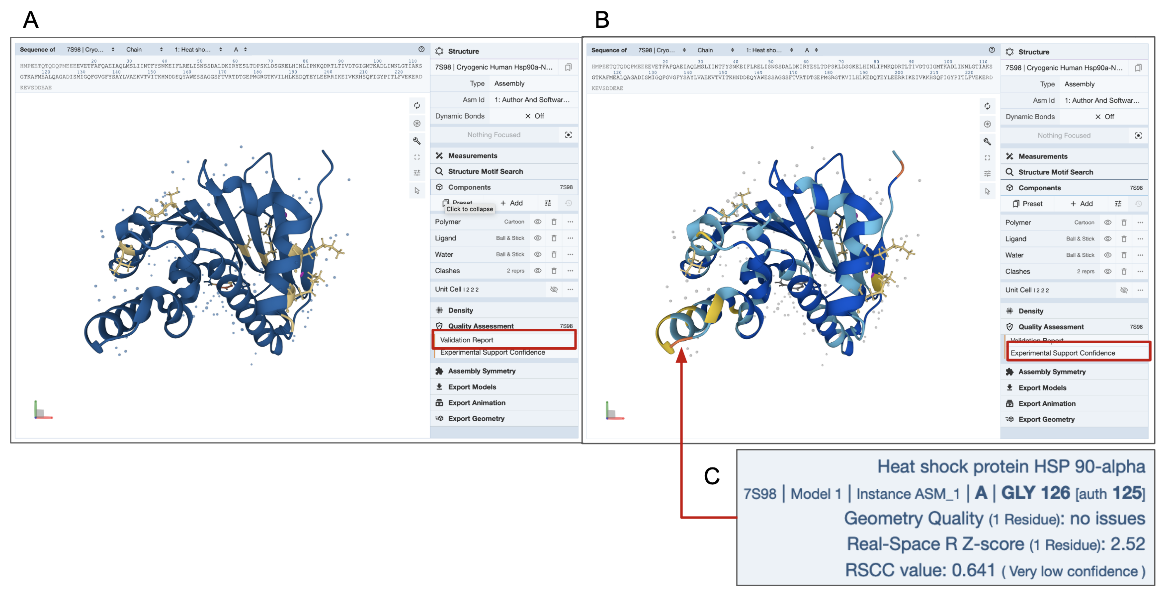
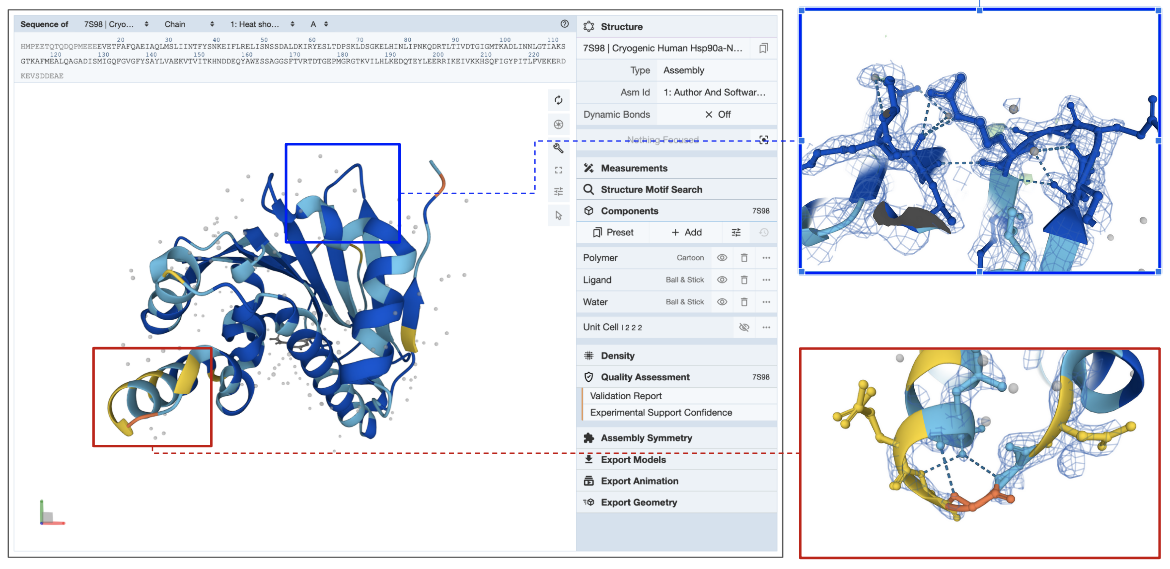
D. 3D View of Quality Assessment: The 3D structure of the molecule is colored by the number of geometry errors for each residue as listed in the validation report. This coloring scheme for geometry issues is available for all types of experimental structures. An additional coloring scheme is available for X-ray structures to examine the Experimental Support Confidence for each residue. Learn more about these quality assessment coloring schemes.
In the example shown here (PDB entry 7s98), residues with a few geometry errors are colored yellow (Figure 4A). The Experimental Support Confidence coloring scheme shows a few residues in yellow or orange color indicating limited experimental support (Figure 4B). Note that a few residues are colored blue in Figure 4A but yellow/orange in Figure 4B (see red arrow and explanation of errors in the residue are shown in Figure 4C). It may be worth viewing the electron density map around these amino acid residues to get a better understanding of the structure quality (see Electron Density Map section of this article below).
|
| Figure 4: Coloring experimental structure (PDB ID 7s98) by quality assessment criteria - A. by Validation Report, and B. by Experimental Support Confidence. C. Mousing over any residue in the structure (see red arrow in panel B) shows various validation details for the residue in the bottom right corner of the 3D Canvas (blue box). |
E. Electron Density Map: The best way to assess how well the model coordinates match the experimental data for X-ray structures is to display the electron density map and the model together. Learn more about displaying Density for X-ray crystallography and EM structures.
In the example shown (PDB entry 7s98), the electron density map is displayed as a blue mesh around the model (see Figure 5). Note that zooming into a region in the structure colored yellow by Experimental Support Confidence (red box) shows limited to missing electron density. Since this part of the model is not supported by experimental data (missing electron density map), information from this region of the model should be used with caution. Another region colored blue by Experimental Support Confidence (blue box) clearly shows the electron density map surrounding the model atoms suggesting that information from this part of the structure is supported by experimental data.
|
| Figure 5: Structure of PDB entry 7s98, colored by the RSCC coloring scheme as seen in Figure 4B. Blue boxed region in the structure shows a good match with the electron density map, while the red box indicates regions with missing/low quality electron density map. |
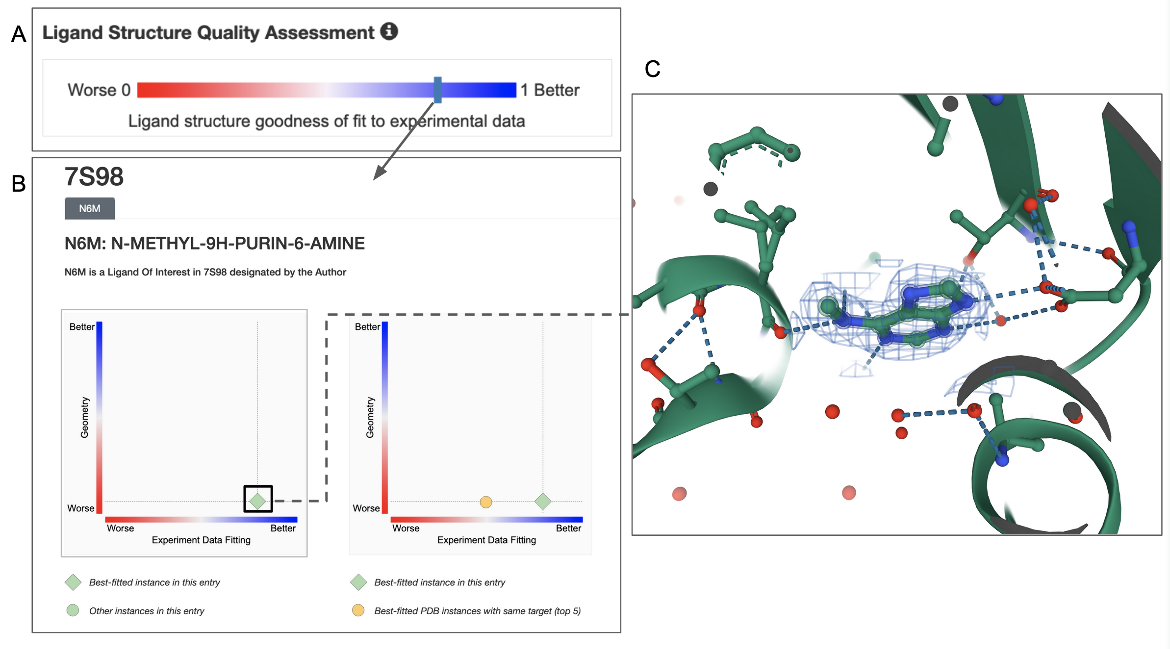
F. Small molecule ligands present in experimental structures (specifically in X-ray structures) also have specific quality assessment measures. Learn more about ligand structure quality.
In the example shown, ligand structure quality in this entry (PDB ID 7s98) can be assessed by clicking on the Ligand Structure Quality Assessment slider on the structure summary page (Figure 6A). Note that the bar indicating the quality of the ligand is towards the blue (better) end. Clicking on this bar opens a structure quality analysis page showing 2D plots of the quality of the specific ligand instance in comparison to other instances in the same or other structures in the archive (Figure 6B). Clicking on the ligand in the plot can show its 3D structure and the electron density around the ligand (Figure 6C). In this case the electron density map and model coordinates match suggesting that the ligand coordinates are supported by experimental data.
|
| Figure 6: Quality assessment of the ligand N6M in the PDB entry 7s98. A. Ligand structure quality assessment slider (available on the structure summary page); B. Ligand quality analysis (available in the Ligands tab for the structure); and C. 3D structure of the ligand model and related electron density in a blue mesh, displayed in the visualization software Mol*. |
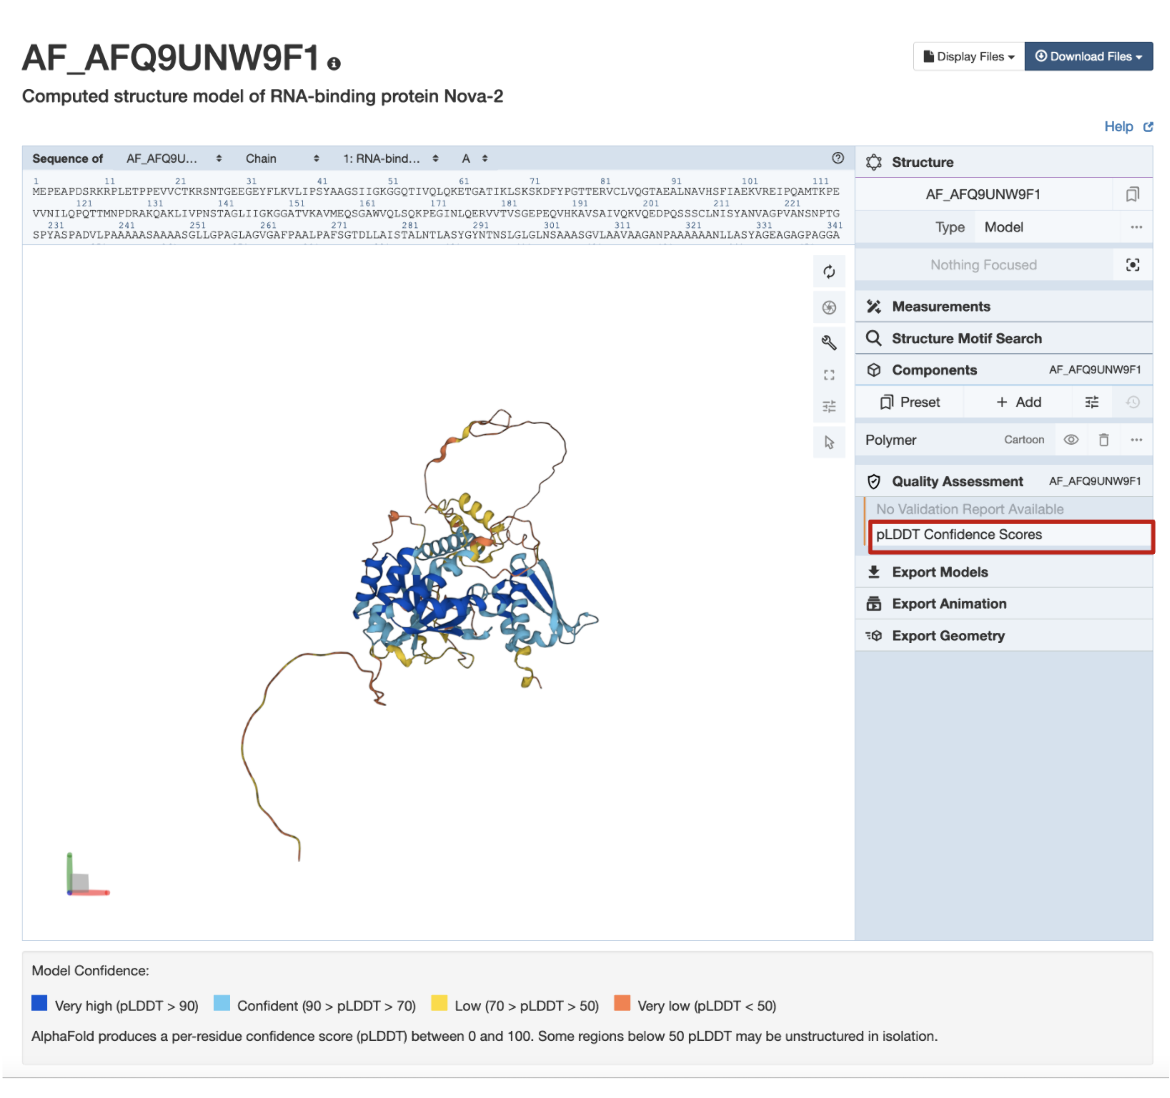
G. The quality of CSMs available from RCSB.org can be displayed in 3D by mapping the residue level measure pLDDT, which ranges from 0 to 100 (Tunyasuvunakool, K., et al., 2021). Parts of the structure with high pLDDT scores are more confidently predicted than regions with lower pLDDT. Regions with very high and high levels of confidence (>70%) are colored dark blue and cyan, respectively, while regions with lower scores are colored yellow or orange. Learn more about these quality assessment coloring schemes.
In the example CSM shown in Figure 7, AlphaFold structure AF-Q9UNW9-F1, the globular domains are supported by sequence, model, and other data, and so are colored in shades of blue indicating high pLDDT scores and a high level of confidence. The coil-like and extended connectors are predicted with less reliability, and so are colored yellow and orange.
|
| Figure 7: Coloring CSMs by quality assessment criteria pLDDT scores for CSM AF_AFQ9UNW9F1 (RCSB.org assigned CSM ID). |
How to use biomolecular structure quality measures?
In general, when a well-resolved experimental structure is available it is preferable to use that over a corresponding CSM. However, whether a model is an experimental structure or a CSM, a review of a combination of quality assessment measures should be done before utilizing it for visualization, analysis, interpreting experimental results, or generating hypotheses.
Here are some ways to review the quality measures of experimental structures:
- The resolution of X-ray and EM structures should be considered - higher resolution typically results in higher confidence in the atomic positions.
- Structures in the blue region of the validation sliders conform better to expected values of conformational geometry and fit of model to experiment. Structures in the red regions may have some problems that should be examined when used.
- Validation measures identify mismatches between the model and experimental data - these structures should be used with caution, especially if the mismatches are in the region of interest (e.g., active site, binding surface) as listed in the validation reports.
- Structures with major geometry errors or stereochemical violations (distortions in bond lengths, bond angles, clashes, torsion angles) may be identified in the color coded quality measures seen in Mol*, and may require additional optimization when used.
When using CSMs, also review the relevant quality measures:
- The pLDDT (global) score is listed on the structure summary page. Additionally, a histogram showing the distribution of residue-level pLDDT scores of the model is also available here. The pLDDT score for each amino acid in the model is mapped on the 3D structure and may be viewed in Mol* (in the Quality Assessments panel).
- To have high confidence in a CSM, not only should the pLDDT (global) score be high, the residue-level pLDDT scores should also be high or very high.
Whenever possible experimental structures and CSMs should be superposed to assess how they match. The pairwise structure alignment tool can be used for this.
When viewing the superposed 3D structures, they may be colored by quality assessment measures, e.g., experimental support confidence coloring for X-ray structures, geometry distortions for all experimental structures, and pLDDT scores for CSMs.
References
- Berjanskii, M. V., and Wishart, D. S. (2005). A simple method to predict protein flexibility using secondary chemical shifts. Journal of the American Chemical Society, 127(43), 14970–14971. https://doi.org/10.1021/ja054842f
- Brünger, A. (1992) Free R value: a novel statistical quantity for assessing the accuracy of crystal structures. Nature 355, 472–475. https://doi.org/10.1038/355472a0
- Henderson, R., Sali, A., Baker, M. L., Carragher, B., Devkota, B., Downing, K. H., Egelman, E. H., Feng, Z., Frank, J., Grigorieff, N., Jiang, W., Ludtke, S. J., Medalia, O., Penczek, P. A., Rosenthal, P. B., Rossmann, M. G., Schmid, M. F., Schröder, G. F., Steven, A. C., Stokes, D. L., … Lawson, C. L. (2012). Outcome of the first electron microscopy validation task force meeting. Structure (London, England : 1993), 20(2), 205–214. https://doi.org/10.1016/j.str.2011.12.014
- Humphreys, I. R., Pei, J., Baek, M., Krishnakumar, A., Anishchenko, I., Ovchinnikov, S., Zhang, J., Ness, T. J., Banjade, S., Bagde, S. R., Stancheva, V. G., Li, X. H., Liu, K., Zheng, Z., Barrero, D. J., Roy, U., Kuper, J., Fernández, I. S., Szakal, B., Branzei, D., … Baker, D. (2021). Computed structures of core eukaryotic protein complexes. Science (New York, N.Y.), 374(6573), eabm4805. https://doi.org/10.1126/science.abm4805
- Jones, T. A., Zou, J. Y., Cowan, S. W., and Kjeldgaard, M. (1991). Improved methods for building protein models in electron density maps and the location of errors in these models. Acta crystallographica. Section A, Foundations of crystallography, 47 ( Pt 2), 110–119. https://doi.org/10.1107/s0108767390010224
- Jumper, J., Evans, R., Pritzel, A. et al. (2021). Highly accurate protein structure prediction with AlphaFold. Nature 596, 583–589. https://doi.org/10.1038/s41586-021-03819-2
- Kleywegt, G. J., Harris, M. R., Zou, J. Y., Taylor, T. C., Wählby, A., & Jones, T. A. (2004). The Uppsala Electron-Density Server. Acta crystallographica. Section D, Biological crystallography, 60(Pt 12 Pt 1), 2240–2249. https://doi.org/10.1107/S0907444904013253
- Montelione, G. T., Nilges, M., Bax, A., Güntert, P., Herrmann, T., Richardson, J. S., Schwieters, C. D., Vranken, W. F., Vuister, G. W., Wishart, D. S., Berman, H. M., Kleywegt, G. J., and Markley, J. L. (2013). Recommendations of the wwPDB NMR Validation Task Force. Structure (London, England : 1993), 21(9), 1563–1570. https://doi.org/10.1016/j.str.2013.07.021
- Necci, M., Piovesan, D., (2021). CAID Predictors. et al. Critical assessment of protein intrinsic disorder prediction. Nat Methods 18, 472–481 https://doi.org/10.1038/s41592-021-01117-3
- Pintilie, G., Zhang, K., Su, Z., Li, S., Schmid, M. F., and Chiu, W. (2020). Measurement of atom resolvability in cryo-EM maps with Q-scores. Nature methods, 17(3), 328–334. https://doi.org/10.1038/s41592-020-0731-1
- Read, R. J., Adams, P. D., Arendall, W. B., 3rd, Brunger, A. T., Emsley, P., Joosten, R. P., Kleywegt, G. J., Krissinel, E. B., Lütteke, T., Otwinowski, Z., Perrakis, A., Richardson, J. S., Sheffler, W. H., Smith, J. L., Tickle, I. J., Vriend, G., and Zwart, P. H. (2011). A new generation of crystallographic validation tools for the protein data bank. Structure (London, England : 1993), 19(10), 1395–1412. https://doi.org/10.1016/j.str.2011.08.006
- Ruff, K. M., & Pappu, R. V. (2021). AlphaFold and Implications for Intrinsically Disordered Proteins. Journal of molecular biology, 433(20), 167208. https://doi.org/10.1016/j.jmb.2021.167208
- Shao, C., Bittrich, S., Wang, S., and Burley, S.K., (2022) “Assessing PDB Macromolecular Crystal Structure Confidence at the Individual Amino Acid Residue Level”, Structure, 30(10):1385-1394.e3. https://doi.org/10.1016/j.str.2022.08.004
- Tunyasuvunakool, K., Adler, J., Wu, Z. et al. (2021). Highly accurate protein structure prediction for the human proteome. Nature 596, 590–596. https://doi.org/10.1038/s41586-021-03828-1
- van Heel, M., Gowen, B., Matadeen, R., Orlova, E. V., Finn, R., Pape, T., Cohen, D., Stark, H., Schmidt, R., Schatz, M., and Patwardhan, A. (2000). Single-particle electron cryo-microscopy: towards atomic resolution. Quarterly reviews of biophysics, 33(4), 307–369. https://doi.org/10.1017/s0033583500003644


